Business
Nike's $170 Billion Collapse (It's Worse Than You Think)
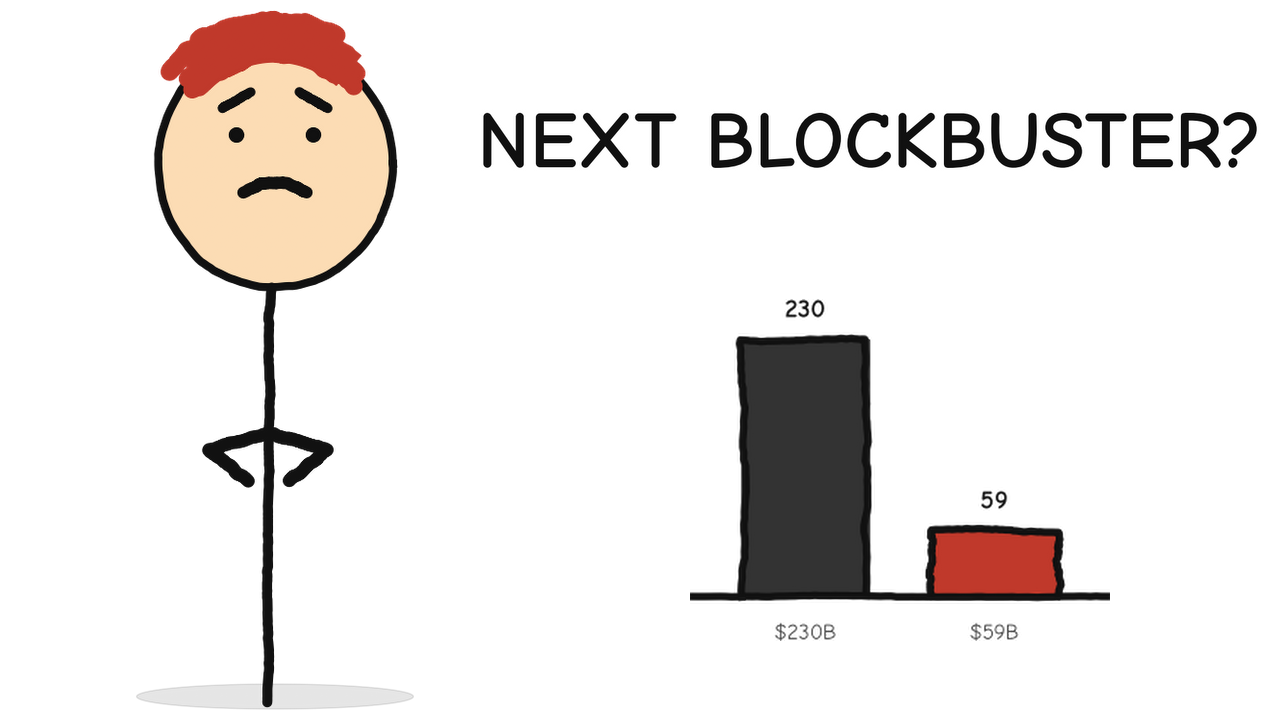
Nike's stock fell 76% in five years, from $169 to $39.60. Everyone is asking if it's the next Blockbuster. The numbers say it's something worse.
Money, markets and the economy explained in short stick-figure videos. Every episode from the Stickman: finance YouTube channel gets a companion page here with the key takeaways.
On YouTube
New episodes land on YouTube first. Each one gets a page here with the key numbers and takeaways.
Watch on YouTube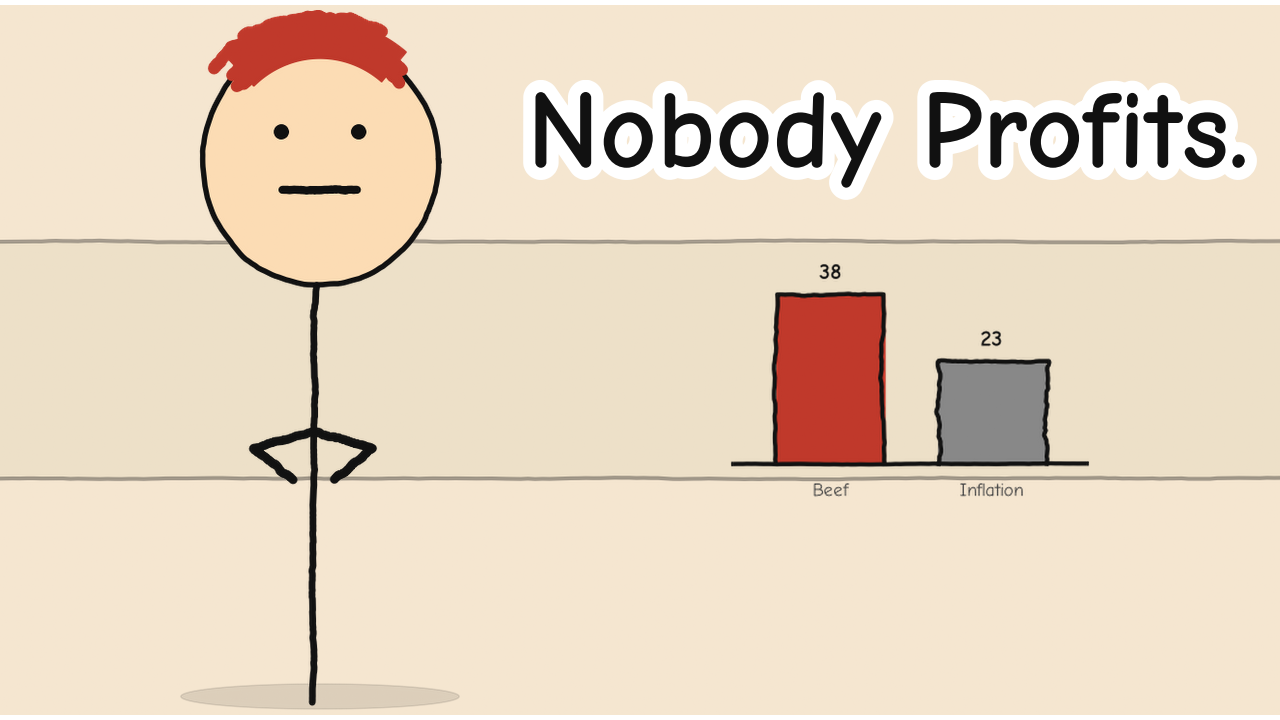
You're paying record prices for ground beef. The rancher is barely breaking even. The meatpacker is losing hundreds of millions. Everyone's turning over...
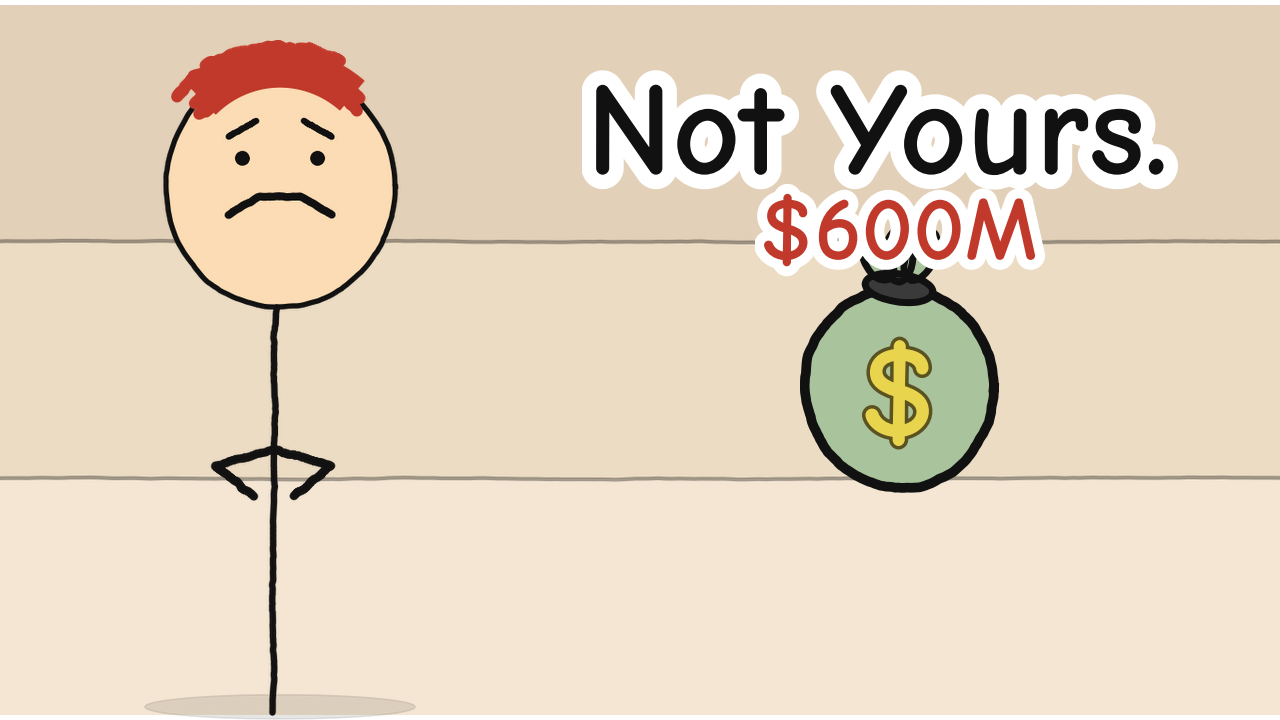
Amazon just received $600 million in tariff refunds after the Supreme Court ruled Trump's import tariffs were illegal. You paid the higher prices. You get...
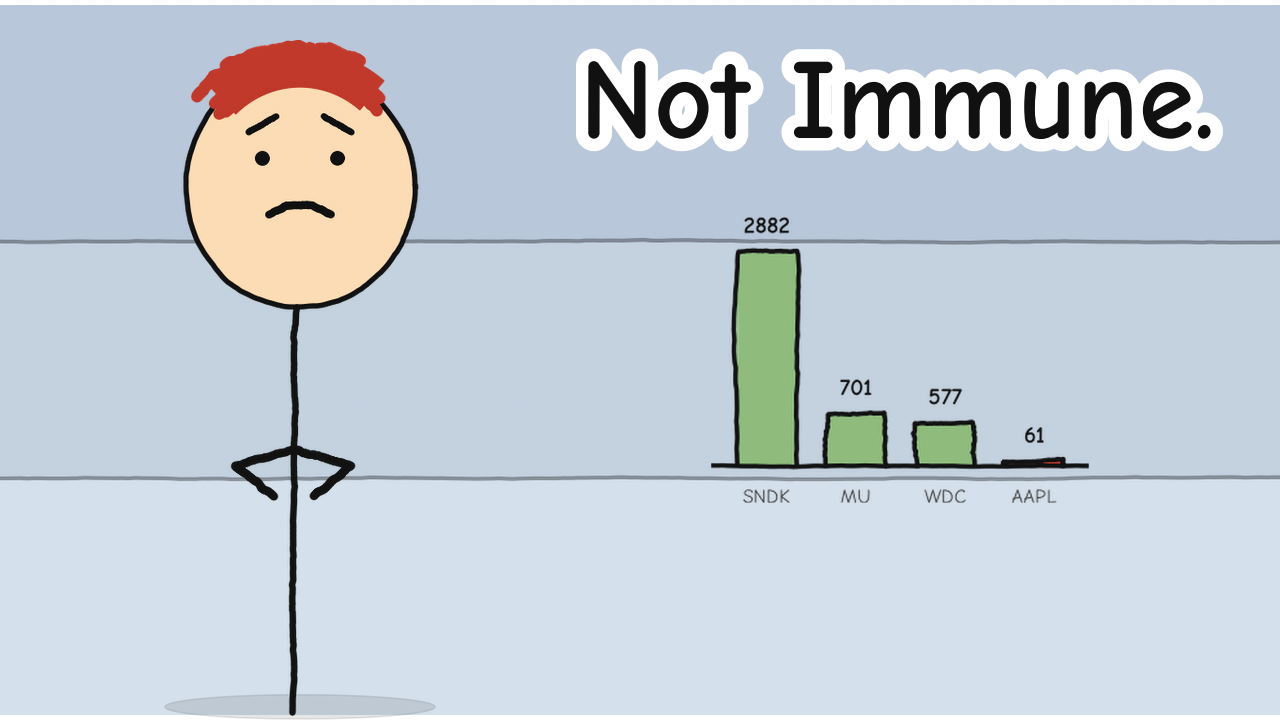
Apple posted record revenue and the stock dropped 7 percent, erasing $315 billion in hours. Tim Cook called the memory chip shortage a hundred-year flood...
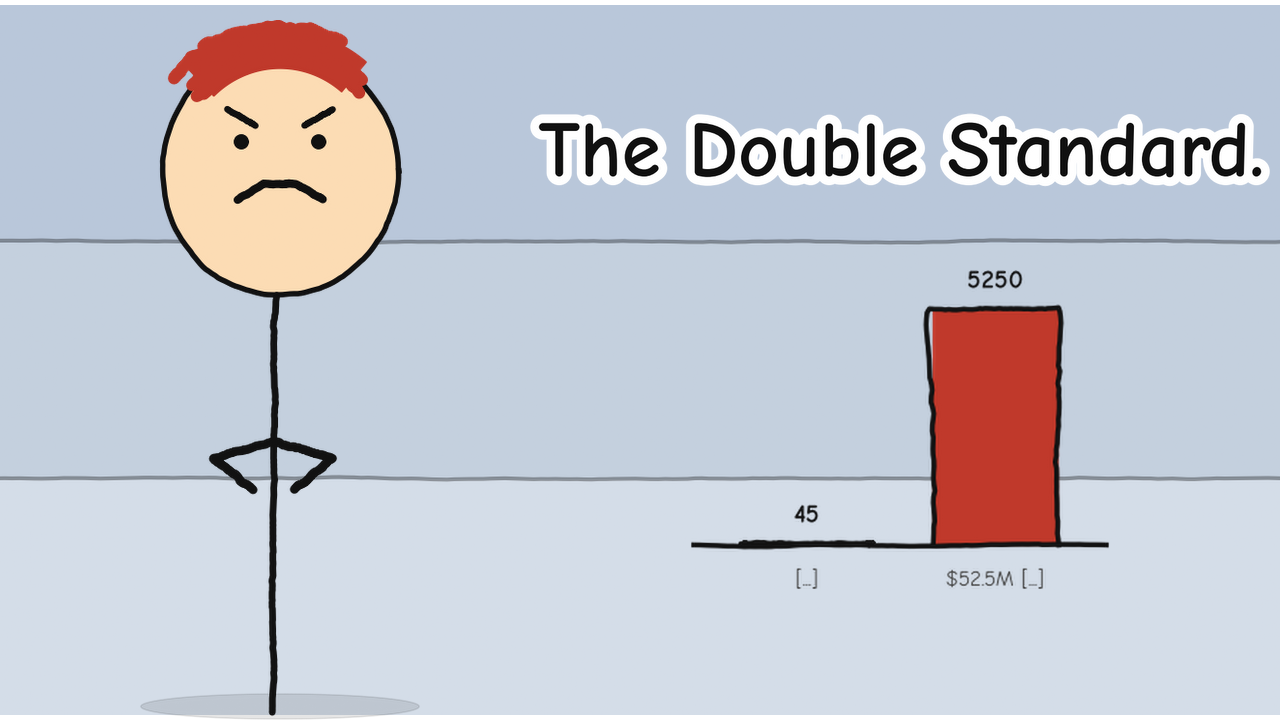
Martha Stewart went to federal prison for avoiding $45,673 in stock losses. Members of Congress trade millions in companies they regulate, and the worst...
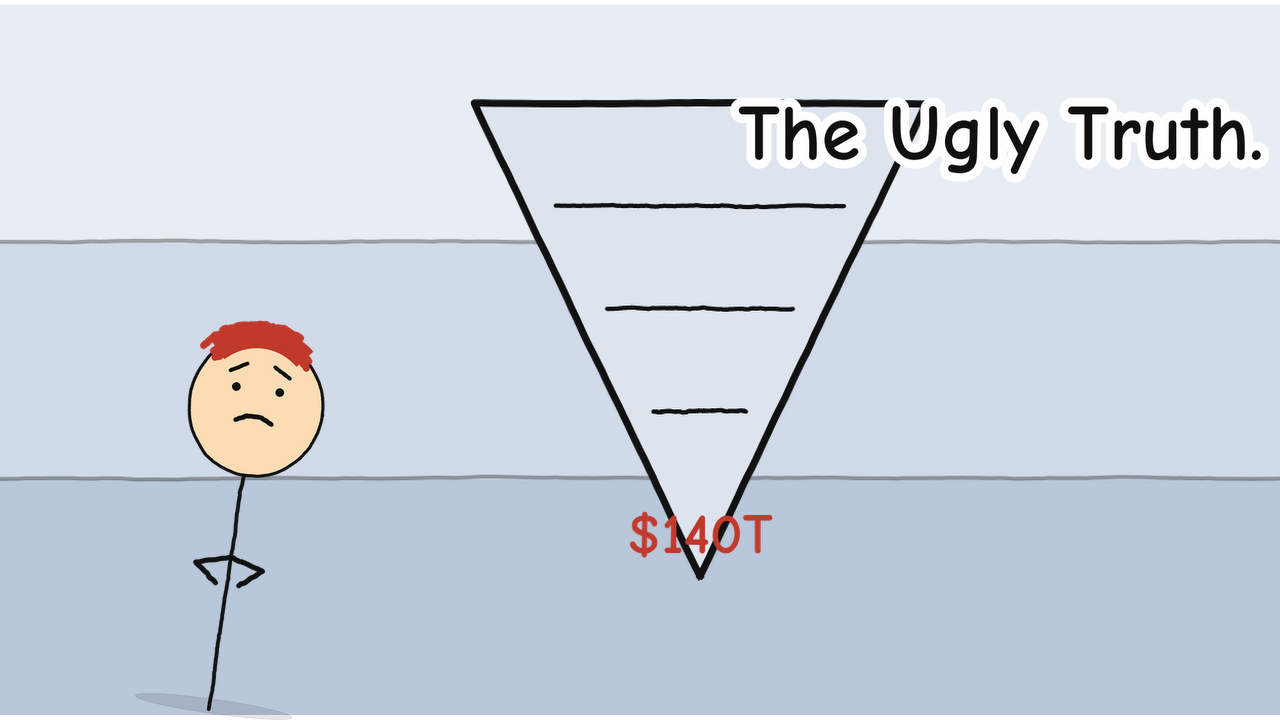
The US government spent $880 billion on interest in 2024, more than the entire defense budget. The global bond market is worth $140 trillion. Is it a...
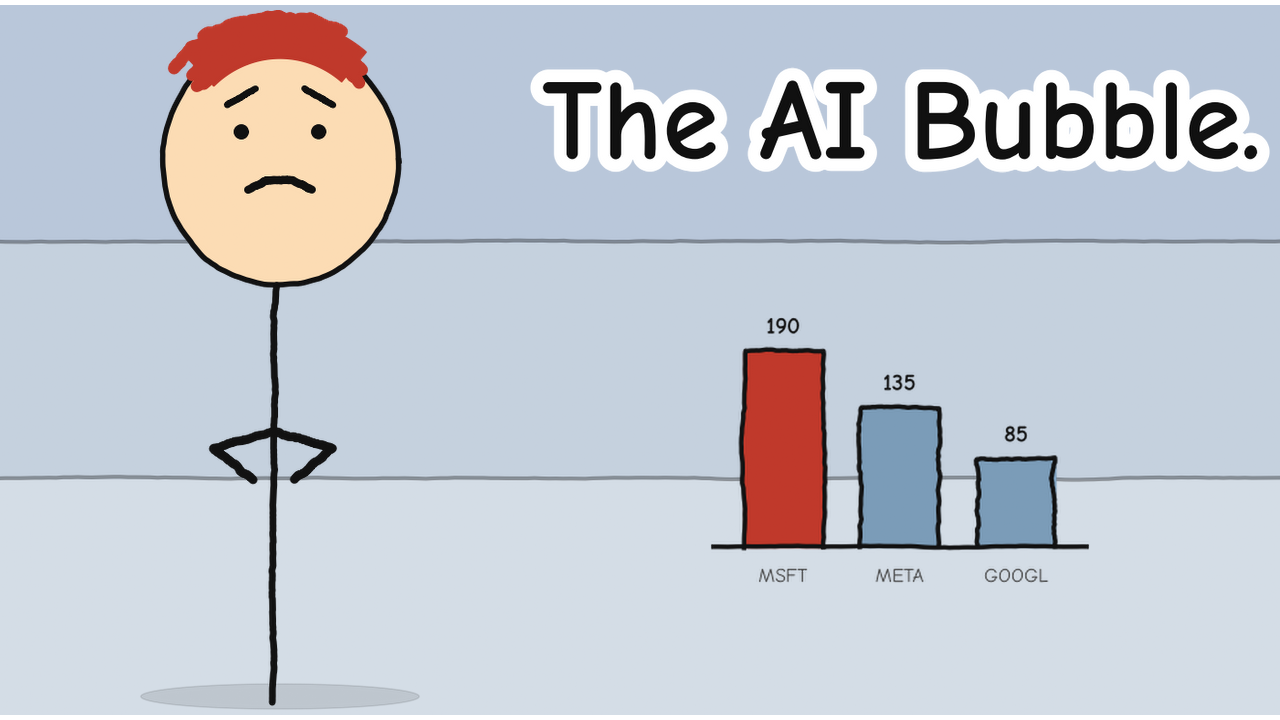
Microsoft has lost $1.1 trillion in market value. Big Tech is spending $725 billion on AI in 2026, and if you have a 401(k), you're helping fund the bet.
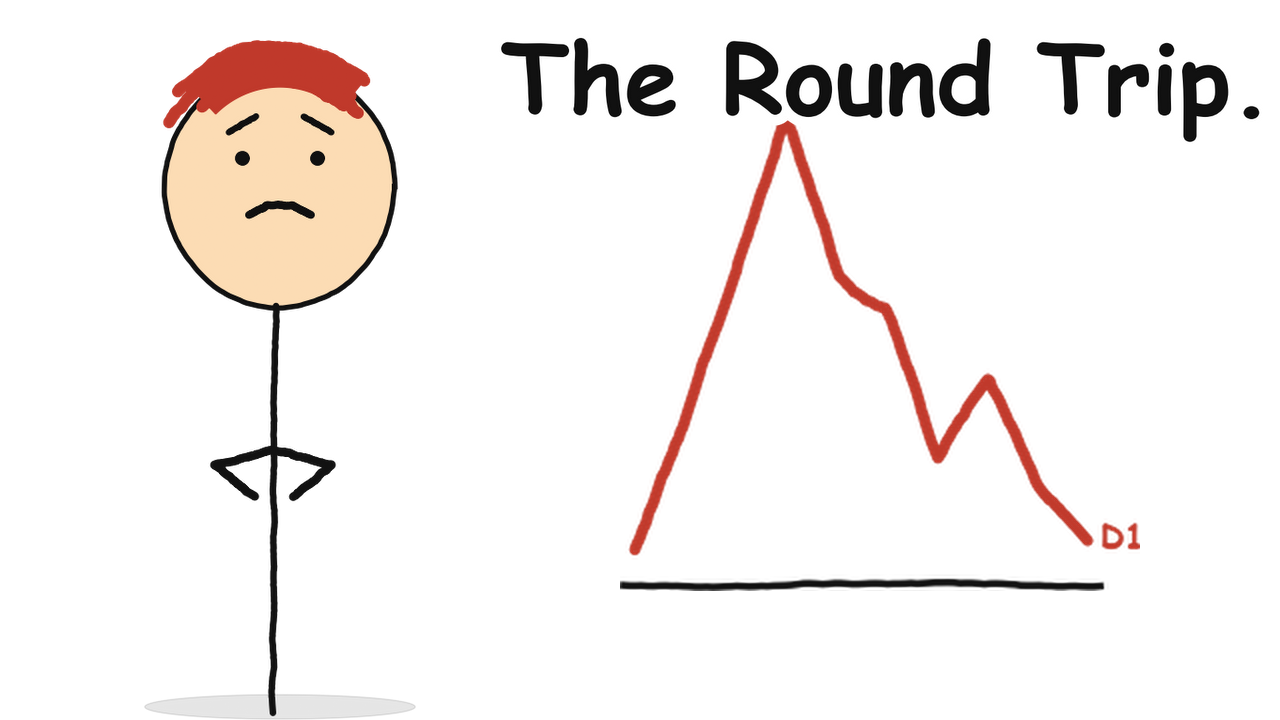
SpaceX went public, hit $3 trillion, then gave it all back in 22 days. If you have a retirement account, you probably own a piece of this.
Wall Street pays Trump Media $100,000 a month to see the President's posts before you do. Here's why that matters.
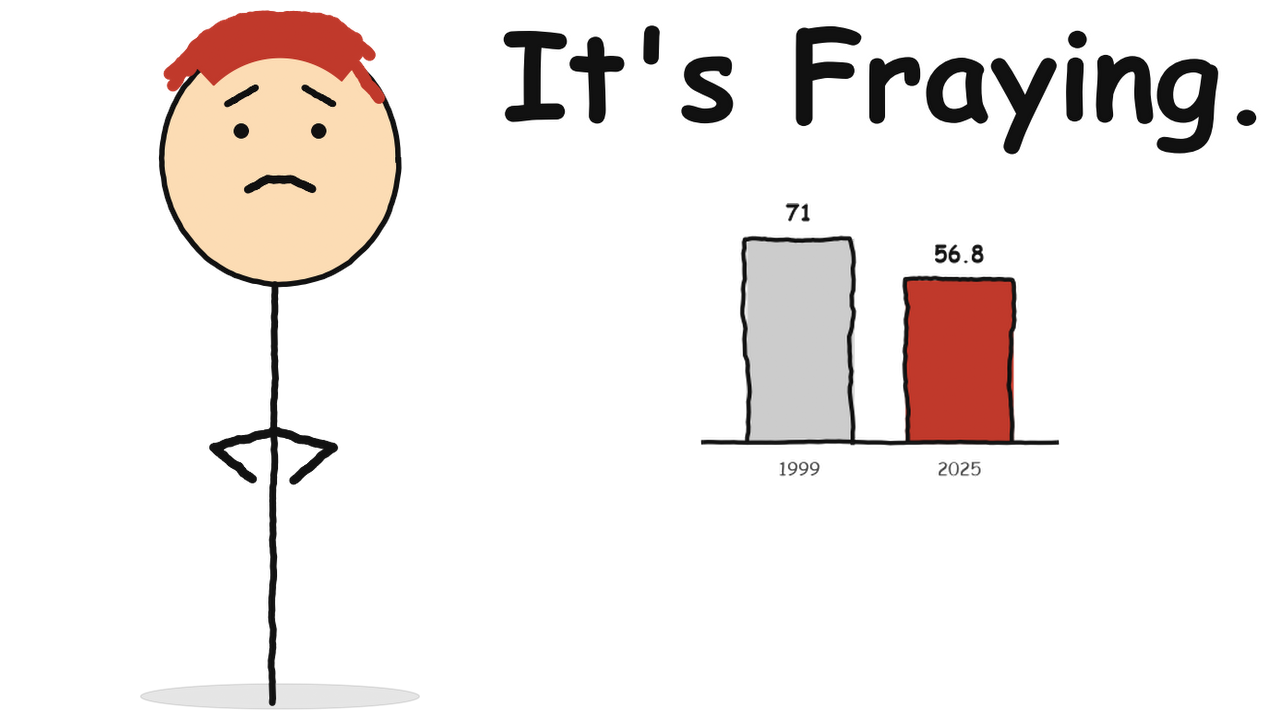
The dollar's share of global reserves fell from 71% to 56.8%. Gold hit $5,318. The president says that's fine. Here's what a weaker dollar actually costs you.
Stickman: finance is a YouTube channel that explains money, markets, and the economy in short stick-figure videos. This section is the channel's companion archive on Data Today: every episode gets a page with the video, the key takeaways, and the full research notes the script was written from.
The companion pages exist because a short video cannot show its sources on screen. Here, every number used in the episode is listed with a link to where it came from: central bank statistics, company filings, index data, and official reports. If a video says a company lost a trillion dollars in market value, the page shows the date range and the data behind that figure.
The videos and their pages take positions. They are explainers in the Opinion Desk, and they are labelled that way. They are general education about how financial systems work, not investment advice, and nothing here tells you what to buy or sell. Our terms of use say the same.
What you will find here:
Each companion page is reviewed by the responsible editor before publication. If you spot a number that does not match its source, write to the corrections address on the contact page and the fix will be logged publicly. The filters above group episodes by topic.
From the Data Today newsroom
These videos are part of Data Today. Read the wider data & AI coverage on the main site.
Go to Data Today