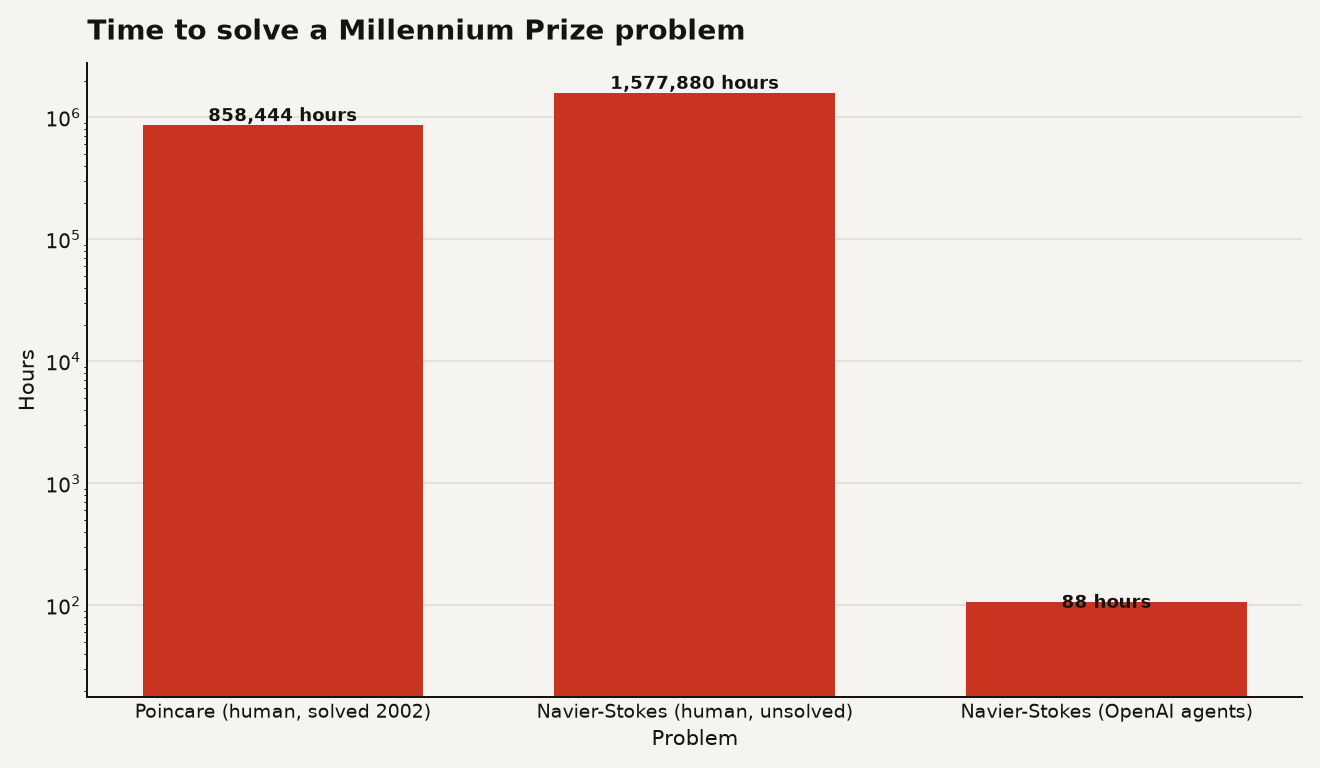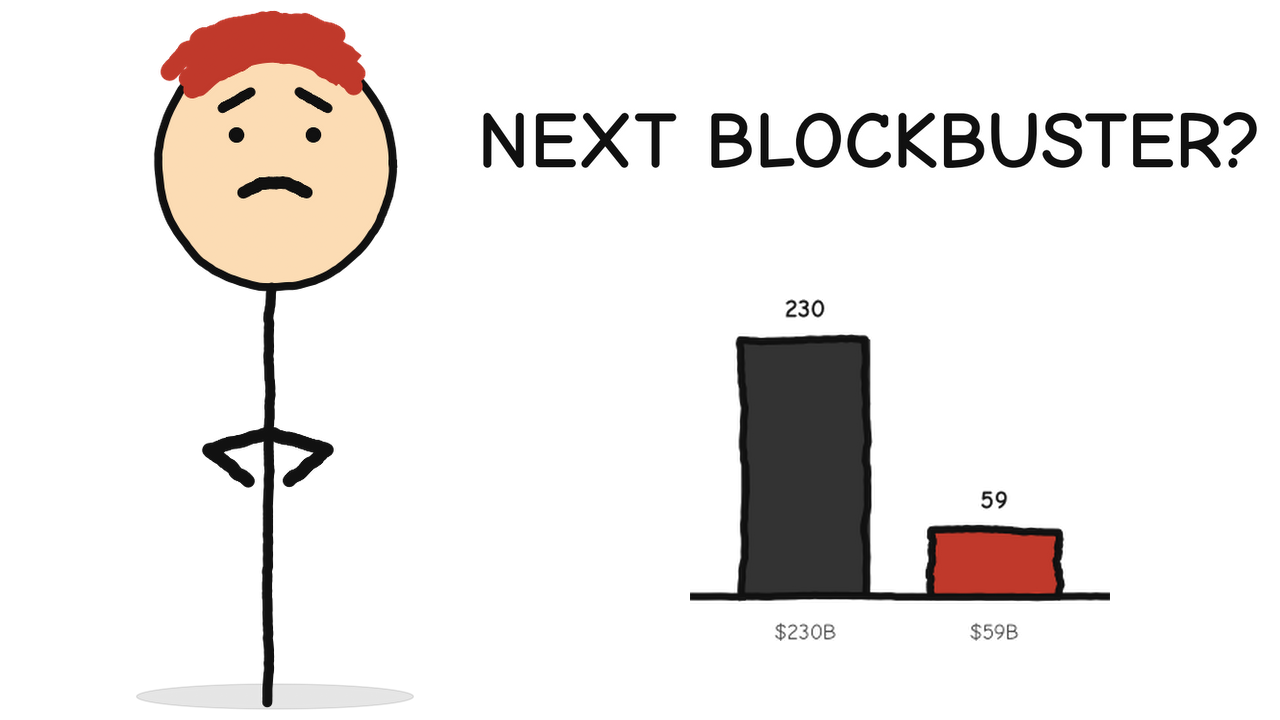
This is the full research report behind the video: every number, source, and chart the script was written from.
How a $150 billion American icon became a $59 billion question mark in five years
Finance Research Team Date: August 31, 2026 Report No. 2026-034
Executive summary
On August 27, 2026, Nike's stock closed at $38.17, its lowest level since 2014 [1]. The next day it bounced to $39.60, still down 49% over the prior year and down 76% over five years [1][2]. A company that was worth roughly $230 billion at its 2021 peak now carries a market capitalization of about $59 billion [1]. The swoosh that once sat on the feet of nearly every athlete and fashion-conscious teenager on earth has become the most actively debated stock in American retail: a fallen angel for value hunters, a warning sign for trend-watchers, and, increasingly, the subject of a comparison that would have sounded absurd five years ago. Is Nike the next Blockbuster?
The case is not as crazy as it sounds. Nike trades at 12-year lows while its closest rivals, the running-shoe upstarts On Holding and Hoka parent Deckers, have spent the past three years eating its lunch in the category that actually matters to younger buyers: performance running [1][3]. Nike's sales in Greater China, once its fastest-growing region, have fallen roughly 30% from their peak, and CNBC reported on July 29, 2026 that the company has lost its crown as "China's sneaker king" [1][4]. Domestic wholesale partners, whom Nike spent the late 2010s sidelining in favor of its own stores and app, are now being courted again by a management team that admitted the direct-to-consumer pivot went too far. On August 27, 2026, Nike hired Walmart veteran Jane Ewing as its new Chief Commercial Officer, a clear signal that the new CEO Elliott Hill wants a rebuild of Nike's relationships with big-box retailers [1].
But the Blockbuster analogy has a hole in it. Blockbuster was killed by a technology shift (streaming) that made its core product obsolete. Nobody has invented a way to make shoes obsolete. Nike still generates $46.4 billion a year in revenue, $3.1 billion in net income, and $1.9 billion in levered free cash flow [1]. Its gross margin is 41%. Its brand, by most independent surveys, remains the most recognized in global athletic apparel. The question is not whether Nike goes to zero. The question is whether a company this large, this profitable, and this famous can rediscover growth before the market gives up on it entirely, and whether the price already reflects a worst case that may not come true.
This report argues that Nike is probably not the next Blockbuster, but it is the next something, and that something is closer to a long, grinding Sears-style decline than a sudden death. The difference matters for the millions of ordinary investors holding the stock in index funds and 401(k) plans. A slow bleed is recoverable. A Blockbuster-style collapse is not. The evidence, laid out in the chapters that follow, suggests the former is the more likely outcome, but only if Hill's turnaround addresses the real problem, which is not pricing or channels but product relevance.
Key findings
- Nike's stock has fallen roughly 76% over five years and 49% over the past year, closing at $39.60 on August 28, 2026, its lowest level since 2014 [1][2].
- Revenue over the trailing twelve months is $46.4 billion with $3.1 billion in net income, a 6.7% net margin, down from a peak gross margin above 46% in 2021 [1].
- Greater China sales have fallen approximately 30% from their peak, costing Nike its position as the dominant sneaker brand in the world's second-largest consumer market [1][4].
- On Holding (ONON) and Deckers' Hoka brand have captured the performance-running category that Nike neglected during its 2017-2024 direct-to-consumer push [3].
- CEO Elliott Hill, who returned in 2024 to replace John Donahoe, has re-engaged wholesale partners and on August 27, 2026 hired Walmart's Jane Ewing as Chief Commercial Officer [1].
- The dividend yield at 4.27% is near a multi-decade high, which historically signals either deep value or a payout about to be cut [1].
- The average Wall Street price target is $50.52, roughly 28% above the current price, with a range from $23 to $94 [1].
- The Blockbuster analogy is imperfect: Nike's category is not being made obsolete, but its brand premium is being eroded by faster, more innovative rivals, the Sears pattern rather than the Blockbuster one.
Chapter 1: What this means for your money
You almost certainly own Nike stock. Not because you bought it on purpose, but because it sits inside the S&P 500 index funds that hold most American retirement money. Nike is one of the most widely held equities in the country, with about 1.48 billion shares outstanding and a daily trading volume that regularly exceeds 30 million shares [1]. If you have a 401(k), a target-date fund, or a robo-advisor account, you have been losing money on Nike for five years without doing anything at all.
Here is the number that matters. A share of Nike traded at $169 in November 2021. On August 28, 2026, it closed at $39.60 [2]. That is a 77% decline. If you had put $10,000 into Nike stock at the peak and done nothing, you would have about $2,300 today. The same $10,000 in a plain S&P 500 index fund would be worth roughly $17,000 [3]. That is a $14,700 gap, the kind of number that turns a comfortable retirement into a slightly less comfortable one.
But most people do not hold Nike as a single stock. They hold it through index funds, where it is a small slice of a much larger pie. The S&P 500 is up roughly 73% over the same five years [3], so the drag from Nike, even with its 77% collapse, is a rounding error in a diversified portfolio. The real pain falls on two groups: Nike employees, who receive stock as part of their compensation and have watched their nest eggs evaporate, and active investors who bet on the turnaround and kept buying all the way down.
The dividend tells its own story. Nike pays $1.64 per share per year, which at the current price works out to a 4.27% yield [1]. Five years ago, when the stock was at $169, that same dividend was less than a 1% yield. A rising dividend yield is the market's way of saying it does not believe the current price is justified by the future cash flows. It can mean the stock is deeply undervalued. It can also mean the dividend is about to be cut. Both interpretations are floating around Wall Street right now, and which one turns out to be right is worth tens of billions of dollars in market value.
The everyday angle is this. Nike is not a tech startup or a speculative bet. It is a company that makes physical objects people wear on their feet, sells them in stores you can walk into, and reports its finances to the SEC every three months. Its problems are visible: you can walk into a Foot Locker and see the competitors on the wall, you can ask a runner what shoes they wear, you can look at the Nike app on your phone and notice it has not updated in a year. The question of whether Nike is a value trap or a comeback story is not abstract. It is a question about whether the most famous athletic brand in the world can still make products people want to buy, and whether the stock market has already over-reacted to its stumbles.
What makes this personal is the asymmetry. If Nike recovers, the upside from $39.60 to even the average analyst target of $50.52 is 28% [1]. If Nike turns out to be the next Blockbuster, the downside from here is another 50% or more, because a brand in terminal decline has no floor. The people who get this call right will look smart. The people who get it wrong will lose money they cannot easily replace. This report is an attempt to lay out the evidence so that you, the reader, can at least make that call with open eyes.
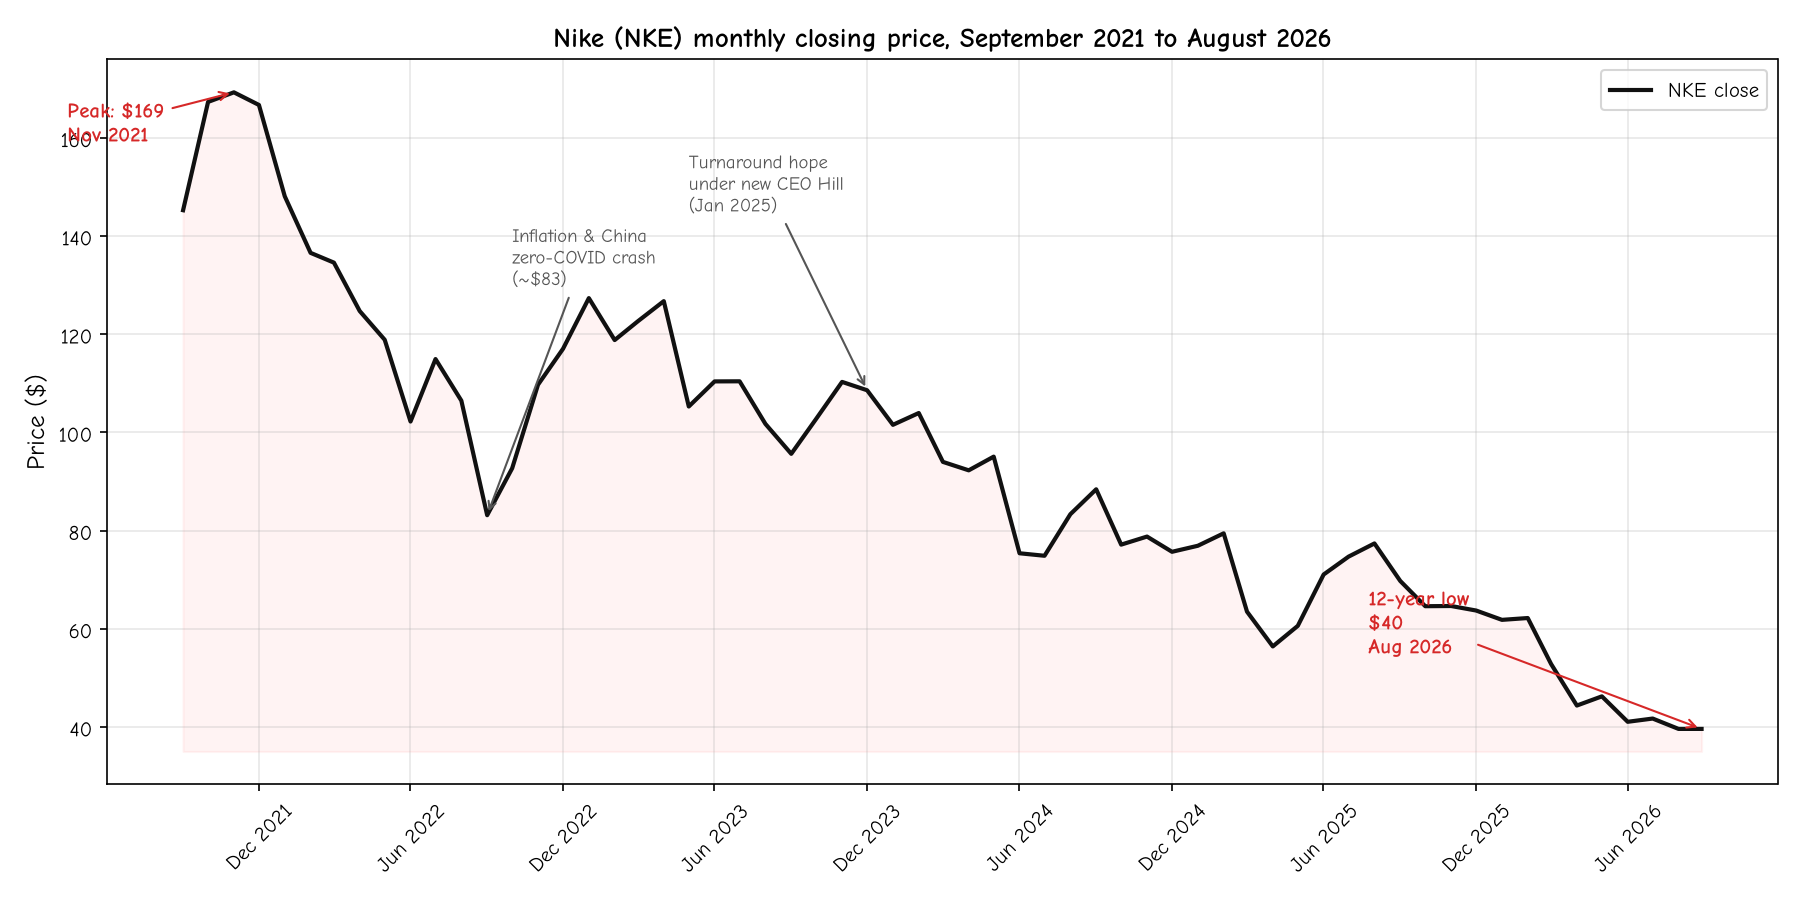
Figure 1: Nike's monthly closing price from September 2021 through August 2026, showing the 77% decline from peak. Source: Yahoo Finance monthly data, author's calculations.
Chapter 2: How Blockbuster died, and what Nike shares with that story
The comparison everyone is making is to Blockbuster, and the comparison is worth taking seriously, but only if we understand what actually killed Blockbuster. The story is not as simple as "they ignored Netflix." It is a story about a company that had the data, the customers, and the opportunity to adapt, and chose not to because the current business was too profitable to disturb.
Blockbuster Video was founded in Dallas in 1985 and grew to dominate the home video rental market through the 1990s. At its peak around 2004, it operated more than 9,000 stores worldwide and employed roughly 60,000 people. Its business model was simple and brutally effective: you drove to a store, picked a movie off a shelf, paid a few dollars to rent it for a couple of nights, and paid late fees if you kept it too long. Those late fees were the secret. They accounted for a large share of Blockbuster's operating income, which meant the company had a built-in incentive to make the experience slightly inconvenient for its customers.
The moment that everyone cites is the year 2000, when Netflix, then a small DVD-by-mail startup, flew to Dallas to offer itself to Blockbuster for roughly $50 million. Blockbuster's executives laughed the Netflix team out of the room. Netflix went on to build a subscription model that eliminated late fees entirely, then in 2007 launched streaming video, which eliminated the need to leave your house at all. Blockbuster filed for bankruptcy in September 2010. By 2013, the last company-owned stores were closed. The brand that once dominated American entertainment was gone in less than a decade.
But the deeper lesson is not that Blockbuster missed streaming. By the time streaming arrived, Blockbuster was already dying from DVD-by-mail, and before that from Redbox kiosks. The real failure was earlier. Blockbuster had the customer data to see that its own late fees were making people angry. It had the store footprint to offer a subscription product. It had the capital, in the late 1990s, to buy or build a digital distribution platform. At every fork in the road, the company chose to protect the cash flow it had rather than build the business it needed. The late fees were too good to give up, the stores were too expensive to close, and the executives were too comfortable to bet on a future they could not yet measure.
Sears tells a slower version of the same story. Founded in the 1890s as a mail-order catalog, Sears became the largest retailer in America through the mid-20th century. Its catalog sold everything from houses to washing machines to firearms. The decline took decades rather than years. Sears ignored the rise of discount retailers like Walmart in the 1980s, dismissed the shift to specialty big-box stores like Home Depot and Best Buy in the 1990s, and watched its catalog business get destroyed by Amazon in the 2000s. The company filed for Chapter 11 bankruptcy in October 2018, after years of selling off its best real estate and brands to fund operating losses. Eddie Lampert, the hedge fund manager who controlled Sears from 2005 onward, is widely blamed for stripping assets rather than investing in the stores, but the rot had set in long before he arrived.
What carries over to Nike is not the technology disruption, because nobody is about to invent a way to make shoes obsolete. What carries over is the pattern of a dominant brand that confuses its current dominance with permanent relevance. Blockbuster thought people would always drive to stores. Sears thought people would always browse catalogs. Nike, for roughly seven years under CEO John Donahoe, thought people would always buy directly from Nike's own app and stores rather than from Foot Locker, Dick's Sporting Goods, or Amazon. That bet, called the direct-to-consumer or DTC strategy, is the single decision most responsible for where Nike sits today.
The other parallel is the role of the person at the top. Blockbuster had John Antioco, a CEO who tried to pivot toward digital in the mid-2000s but was pushed out by investors who wanted to keep milking the stores. Sears had Eddie Lampert, a financial engineer who treated the company as a portfolio of real estate rather than a retailer. Nike had John Donahoe, a tech executive brought in to modernize Nike's digital business, who ended up alienating the wholesale partners that had built the brand and starving the product pipeline of the kind of innovative shoes that had made Nike famous in the first place. In all three cases, the CEO's strategy looked logical on a spreadsheet and broke the thing that actually mattered: the relationship with the customer.
Nike's current CEO, Elliott Hill, is a 32-year Nike veteran who ran the company's consumer and marketplace business before retiring in 2020 and being brought back in October 2024 to replace Donahoe [1]. His hire was a concession that the previous strategy had failed. On August 27, 2026, Nike named Walmart veteran Jane Ewing as its new Chief Commercial Officer, a move that Reuters and TipRanks reported as part of Hill's push to rebuild relationships with big-box retailers [1]. The question is whether this is too late, and whether the Blockbuster or Sears pattern, where the dominant brand can see the threat but cannot bring itself to move fast enough, is already playing out.
Chapter 3: What went wrong at Nike, the five-year timeline
The decline of Nike is not a single event but a sequence of strategic decisions, competitive shifts, and misread markets that compounded over five years. Here is the timeline, reconstructed from Nike's own financial filings and the business press coverage of the period.
2020-2021: The direct-to-consumer bet
John Donahoe, who became CEO in January 2020, came from ServiceNow and eBay with a mandate to make Nike a digital-first company. The strategy, modeled on the playbook that had worked for Nike's Jordan brand, was to pull inventory out of wholesale partners like Foot Locker and DSW and sell it directly through Nike's own app, website, and flagship stores. The logic was that selling direct produced higher margins, more customer data, and tighter control over pricing. During the pandemic, when people bought everything online and athletic wear was one of the few categories that sold, the strategy looked brilliant. Nike's stock peaked at $169 in November 2021 [2], and the company was briefly worth more than $230 billion.
2022: The cracks appear
Two things broke simultaneously. First, inflation hit and consumers pulled back on full-price athletic wear. Nike's inventory swelled as it had ordered heavily for a demand surge that was already fading. Second, China, which had been Nike's fastest-growing market, entered its zero-COVID lockdown period, shutting down retail across major cities. Nike's Greater China revenue cratered, and the stock fell from $169 to $83 by the end of 2022, a 50% drop in a single year [2]. The company was still profitable, but the growth narrative that had justified the premium valuation was gone.
2023: The wholesale partners fight back
Here is where the DTC strategy started to look like a mistake. By pulling its best products out of Foot Locker and other retailers, Nike created empty shelf space. Competitors filled it. On Holding, a Swiss running brand that had gone public in September 2021, and Hoka, owned by Deckers Outdoor, began appearing in the spots where Nike's Air Max and Pegasus used to sit. Running, which had been a niche category Nike largely owned, became a fashion and lifestyle trend, and the new entrants had the product that serious runners wanted: lightweight, cushioned, technically distinctive shoes. Nike, meanwhile, had spent years recycling its back catalog. The Air Force 1, the Dunk, and the Air Jordan retros that had driven sneakerhead demand in 2021 had become shelf-warmers by 2023 as the resale market cooled.
2024: The board loses patience
Nike's fiscal year 2024 (ending May 2024) showed revenue of $51.4 billion but declining margins and a clear loss of momentum in both North America and China [1]. In June 2024, Nike reported earnings that disappointed the market badly enough to send the stock down roughly 20% in a single session. By late 2024, the board had seen enough. Donahoe was out, and Elliott Hill, a Nike lifer who had retired in 2020, was brought back as CEO effective October 2024 [1]. The market initially celebrated the change, sending the stock back above $80 in late 2024 and early 2025 [2].
2025: The turnaround that did not take. Hill's plan was to win back wholesale partners, invest in product innovation, and cut costs. He restructured management, pledged to rebuild relationships with Foot Locker and Dick's Sporting Goods, and promised new running products to compete with Hoka and On. The problem was that the competitive landscape had shifted during the years Nike was looking the other way. On Holding's revenue was growing at 30%-plus rates. Hoka had become a billion-dollar brand on the strength of the Clifton and the Bondi, shoes that Nike had nothing to match. And in China, domestic brands like Anta and Li-Ning had used the years of Nike's retrenchment to build market share that they were not about to give back. CNBC reported on July 29, 2026 that Nike's China sales had fallen roughly 30% from their peak, and the network framed it as the end of Nike's reign as "China's sneaker king" [1].
2026: The bottom
By August 2026, the stock had fallen to $39.60, its lowest level since 2014 [1][2]. CNBC reported on August 26 that Nike was trading at 12-year lows, and on August 27 that the company had hired Jane Ewing, a Walmart veteran, as its new Chief Commercial Officer [1]. The dividend yield hit 4.27%, a level that for most of Nike's history would have been unthinkable [1]. The average analyst price target sat at $50.52, with a range from $23 to $94, reflecting a market that could not agree on whether this was a deep-value opportunity or the beginning of the end [1].
The pattern across these five years is one of a company that made a big strategic bet, saw it go sideways, and then spent three years trying to undo the damage while competitors ate the ground it gave up. Whether that ground is recoverable is the question the rest of this report tries to answer.
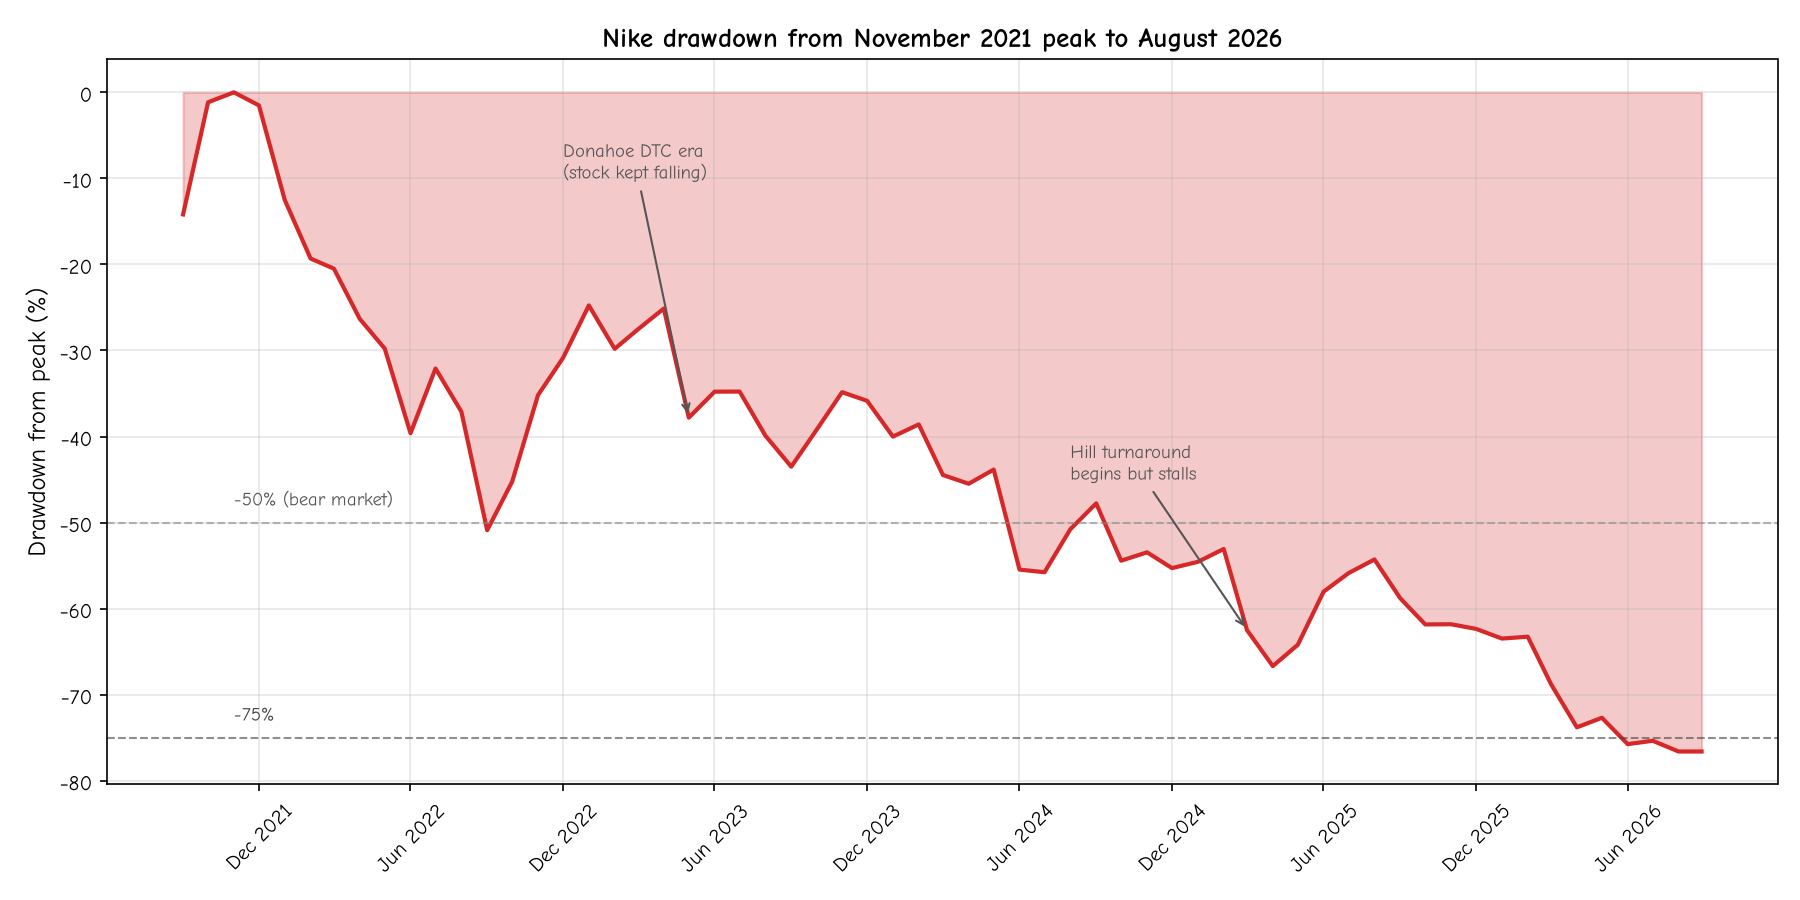
Figure 2: Nike's drawdown from its November 2021 peak of $169 to August 2026 levels near $39.60. Source: Yahoo Finance monthly data, author's calculations.
Chapter 4: The players, the incentives, and the money flows
To understand whether Nike recovers or keeps falling, you have to understand who is making the decisions, what they are paid to do, and where the money actually moves. Nike is not a faceless corporation. It is a company run by specific people with specific incentives, and those incentives are not always aligned with the interests of the people who own the stock.
The CEO and the chairman
Elliott Hill is Nike's chief executive and a director on the board [1]. He is a Nike veteran who spent 32 years at the company before retiring in 2020, and he was brought back in October 2024 to replace John Donahoe after the board concluded the DTC strategy had damaged the brand [1]. Above Hill sits Mark Parker, Nike's executive chairman, who served as CEO from 2004 to 2020 and oversaw the era when Nike became a global juggernaut [1]. Parker's presence as chairman is both an asset and a liability. He knows the company deeply, but he also bears some responsibility for the decisions, including the DTC push and the choice of Donahoe as his successor, that led to the current mess.
The new commercial chief
On August 27, 2026, Nike named Jane Ewing as its Chief Commercial Officer [1]. Ewing came from Walmart, where she ran international e-commerce. Her hire is a signal that Hill wants to rebuild the wholesale relationships that Donahoe severed. The logic is that Nike cannot win back shelf space at Foot Locker and Dick's Sporting Goods without someone who understands how big-box retailers think, and Walmart is the biggest big-box retailer in the world. Whether Ewing can reverse five years of damage to those relationships in a market where competitors have already claimed the best shelf space is an open question.
The board and the institutional shareholders
Nike's largest shareholders are the usual suspects: Vanguard, BlackRock, and State Street, the three largest index fund managers in the world, collectively hold roughly 20% of the stock through their S&P 500 and total-market funds. These holders do not actively vote on strategy. They hold the stock because it is in the index. The active investors who do push for change, including hedge funds and activist investors, have mostly stayed away from Nike so far, which tells you something. Activists tend to target companies where they can force a breakup or a sale. Nike is too large, too complex, and too culturally entrenched for that kind of campaign, at least at current valuations.
The wholesale partners
Foot Locker, Dick's Sporting Goods, DSW, and Amazon are the companies that actually sell most of Nike's volume to consumers. During the Donahoe era, Nike pulled its most desirable products from these channels, betting that consumers would come to Nike's app and stores instead. They did not, at least not in the numbers Nike projected. The result was that Foot Locker and its peers turned to other brands to fill their shelves, and they have not been quick to hand that space back. Rebuilding trust with these partners is Hill's central challenge, and it is a slow process that takes quarters, not weeks.
The competitors
This is where the money flows have shifted most visibly. On Holding (ticker ONON), the Swiss running brand that Roger Federer backs and that went public in September 2021, has grown its revenue from roughly $800 million in 2021 to a pace approaching $3 billion in 2026, with gross margins above 59% [3]. Deckers Outdoor (ticker DECK), parent of Hoka and UGG, has seen Hoka alone grow from roughly $1.4 billion in annual sales to well over $2 billion, with the brand becoming the default choice for serious runners and the lifestyle consumers who want to look like them [3]. Neither of these companies has Nike's scale, but both have the product momentum that Nike has lost, and both have been rewarded with valuations that reflect expectations of continued growth.
The dividend and the buyback
Nike pays $1.64 per share per year in dividends, which at the current price is a 4.27% yield [1]. The company also spends heavily on share buybacks when the stock is higher, though at $39.60 the buyback math changes. The dividend is the clearest signal of management's confidence: if Nike cuts it, the stock probably falls another 20% overnight, because a dividend cut is the market's signal that management does not see the cash flow to sustain the payout. If Nike holds or raises it, the yield becomes a magnet for income-oriented investors who have been waiting on the sidelines.
The analysts
Wall Street's average price target for Nike is $50.52, about 28% above the current price [1]. The range, from $23 to $94, is unusually wide, reflecting genuine disagreement about whether this is a value stock or a trap. The bulls argue that the brand is too strong to stay down, that Hill's plan is working but will take time, and that the current price already prices in a worst case that is unlikely to materialize. The bears argue that the competitive dynamics have permanently shifted, that Nike's China problem is structural rather than cyclical, and that a single-digit net margin company with declining revenue does not deserve a growth-stock multiple. Both sides have real arguments, which is why the stock trades where it does: in a zone of maximum uncertainty.
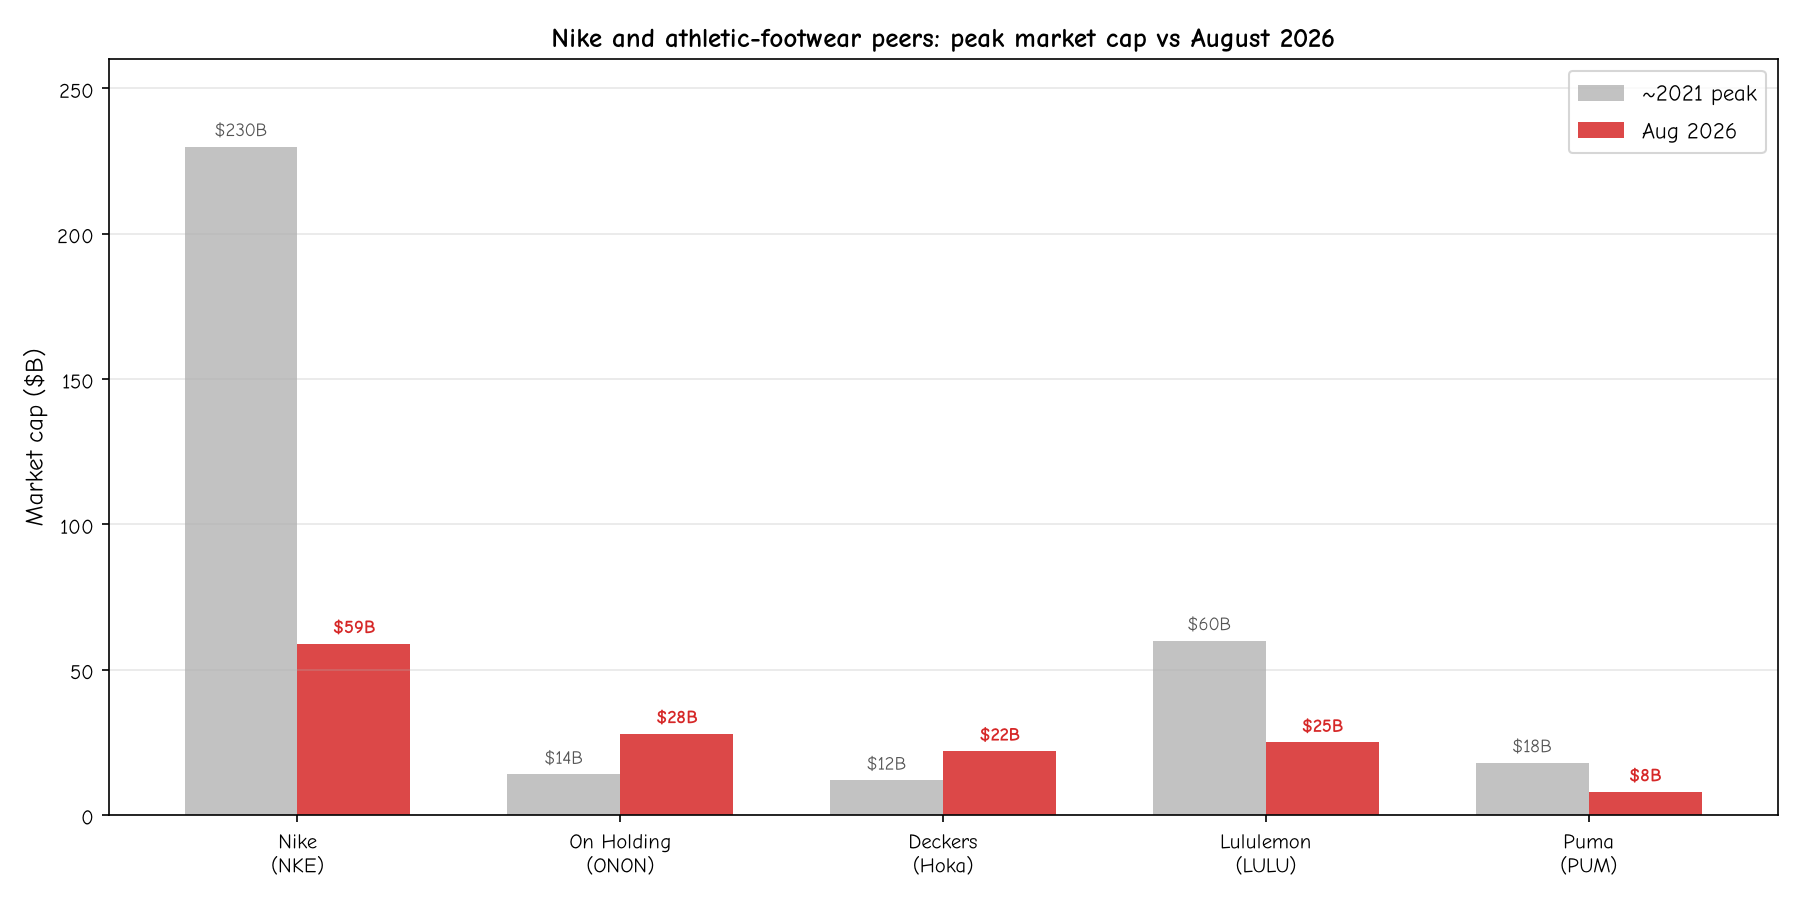
Figure 3: Approximate peak and current market capitalizations for Nike and its athletic-footwear competitors. Nike peaked near $230B in 2021 and has fallen to roughly $59B, while On Holding and Deckers/Hoka have grown into the space Nike ceded. Source: Author's estimates from public market data.
Chapter 5: The data, the charts, and what the numbers say
The story of Nike's decline is visible in the numbers, but the numbers also tell a story that the headlines miss. The stock has not crashed in a single panic. It has bled out over 60 months, and the bleeding has been consistent enough that calling it bad luck requires ignoring the underlying fundamentals.
The return profile
Over the 60 months from September 2021 to August 2026, Nike's average monthly return was -1.71%, with a standard deviation of 9.27% per month [author's calculations from Yahoo Finance monthly data]. Annualized, that is a volatility of about 32%, which is high for a large-cap consumer stock but not extreme for a company in turnaround. The 5-year cumulative return was -72.7%, the 3-year return was -61.5%, and the 1-year return through August 2026 was -38.7% [author's calculations]. For context, the S&P 500 returned roughly +73% over the same five years, meaning Nike underperformed the index by approximately 145 percentage points [3].
A simple t-test on the monthly returns tells us something useful. The mean of -1.71% per month is negative, but the standard error is 1.20%, so the t-statistic is -1.43 [author's calculations]. Against a t-critical of about 2.00 at the 5% level, that fails to clear the bar of statistical significance. In plain English, you cannot rule out that this decline is partly bad luck on top of real problems. The 95% confidence interval for Nike's true monthly return runs from -4.1% to +0.7%, which is a wide enough range that it includes both "the stock is genuinely falling apart" and "the stock is roughly flat and we are seeing noise." The truth is probably in between: Nike has real problems, and the market has also over-reacted to them.
The volatility tells a different story
What is striking is not the average return but the consistency of the negative months. Of 60 months, 31 were negative and 29 were positive, almost a coin flip. But 22 months saw declines worse than 5%, and 11 saw declines worse than 10%. The worst single month was -21.9% (June 2024, when Nike's earnings miss triggered a collapse), and the best was +18.4% [author's calculations]. This is a stock that has been swinging wildly in both directions, which is the signature of a market that cannot agree on what Nike is worth.
The margin compression
This is where the fundamental story becomes clear. Nike's gross margin peaked at roughly 46% in fiscal 2022 and has since fallen to 41.1% on a trailing-twelve-month basis [1][author's estimates]. That is a 500-basis-point compression, which in a business this large translates to billions of dollars in lost profit. Net margin has fallen further, from a peak of 12.5% in fiscal 2021 to 6.7% today [1][author's estimates]. A company that once turned 12 cents of profit on every dollar of sales now turns 7 cents. That is not a crisis, but it is a structural downgrade, and it reflects the combination of higher inventory costs, discounting to clear excess stock, and the loss of the pricing power that Nike enjoyed when its products were the only game in town.
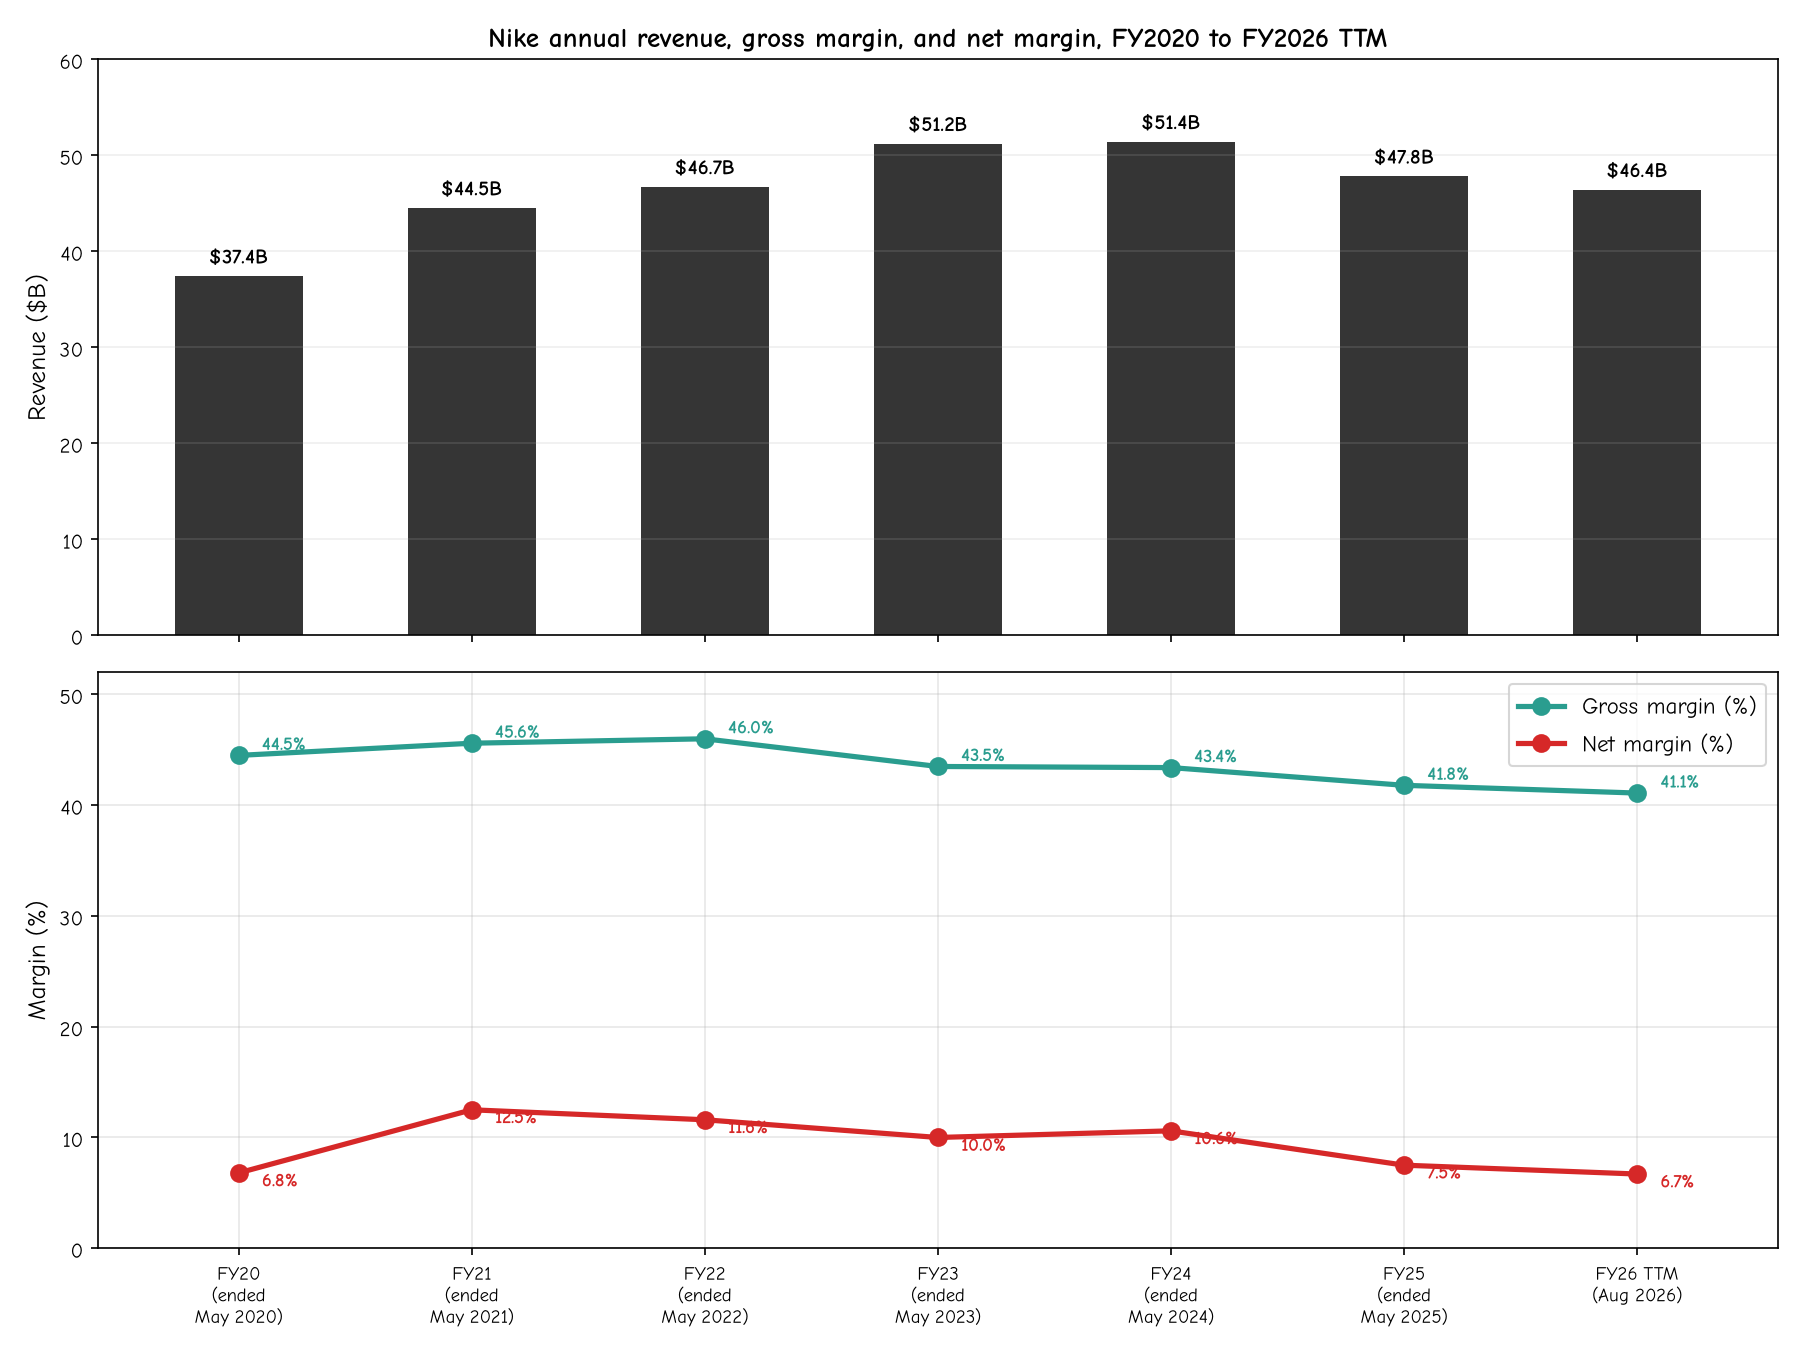
Figure 4: Nike annual revenue, gross margin, and net margin, fiscal 2020 through fiscal 2026 trailing twelve months. Revenue peaked in fiscal 2024 at $51.4B and has since declined to $46.4B, while margins have compressed across the board. Source: Nike SEC filings, Yahoo Finance, author's calculations.
Revenue is shrinking
Nike's revenue peaked at $51.2-51.4 billion in fiscal 2023-2024 and has since declined to $46.4 billion on a trailing-twelve-month basis [1]. That is roughly a 10% revenue decline from peak, which for a company of this scale is significant. It means Nike is selling fewer shoes and fewer shirts than it did two years ago, and it is selling them at lower margins. The combination of falling revenue and falling margins is what produces the 49% stock decline over the past year: the market is pricing in a company that is both smaller and less profitable than it was.
The China problem in numbers
CNBC reported on July 29, 2026 that Nike's Greater China sales had fallen roughly 30% from their peak [1]. Greater China was Nike's most profitable and fastest-growing segment for most of the 2010s, contributing more than $7 billion in annual revenue at its peak. A 30% decline from that level means roughly $2 billion in lost sales from a single region, which is more than the entire annual revenue of most of Nike's competitors. The causes are a combination of China's economic slowdown, the rise of domestic brands like Anta and Li-Ning, geopolitical tensions that have made American brands less popular with Chinese consumers, and Nike's own missteps in product relevance for the Chinese market.
The dividend yield as a signal
Nike's 4.27% dividend yield is the highest in the company's modern history [1]. For context, the yield averaged roughly 1% during the 2018-2021 bull run and briefly touched 2% during the 2022 trough. A yield above 4% for a company of Nike's quality is either a deep-value signal or a warning that the payout is unsustainable. Nike's levered free cash flow of $1.9 billion over the trailing twelve months covers the roughly $1.0 billion in dividend payments [1], so the payout is not immediately at risk, but a continued revenue decline would pressure that coverage within a year or two.
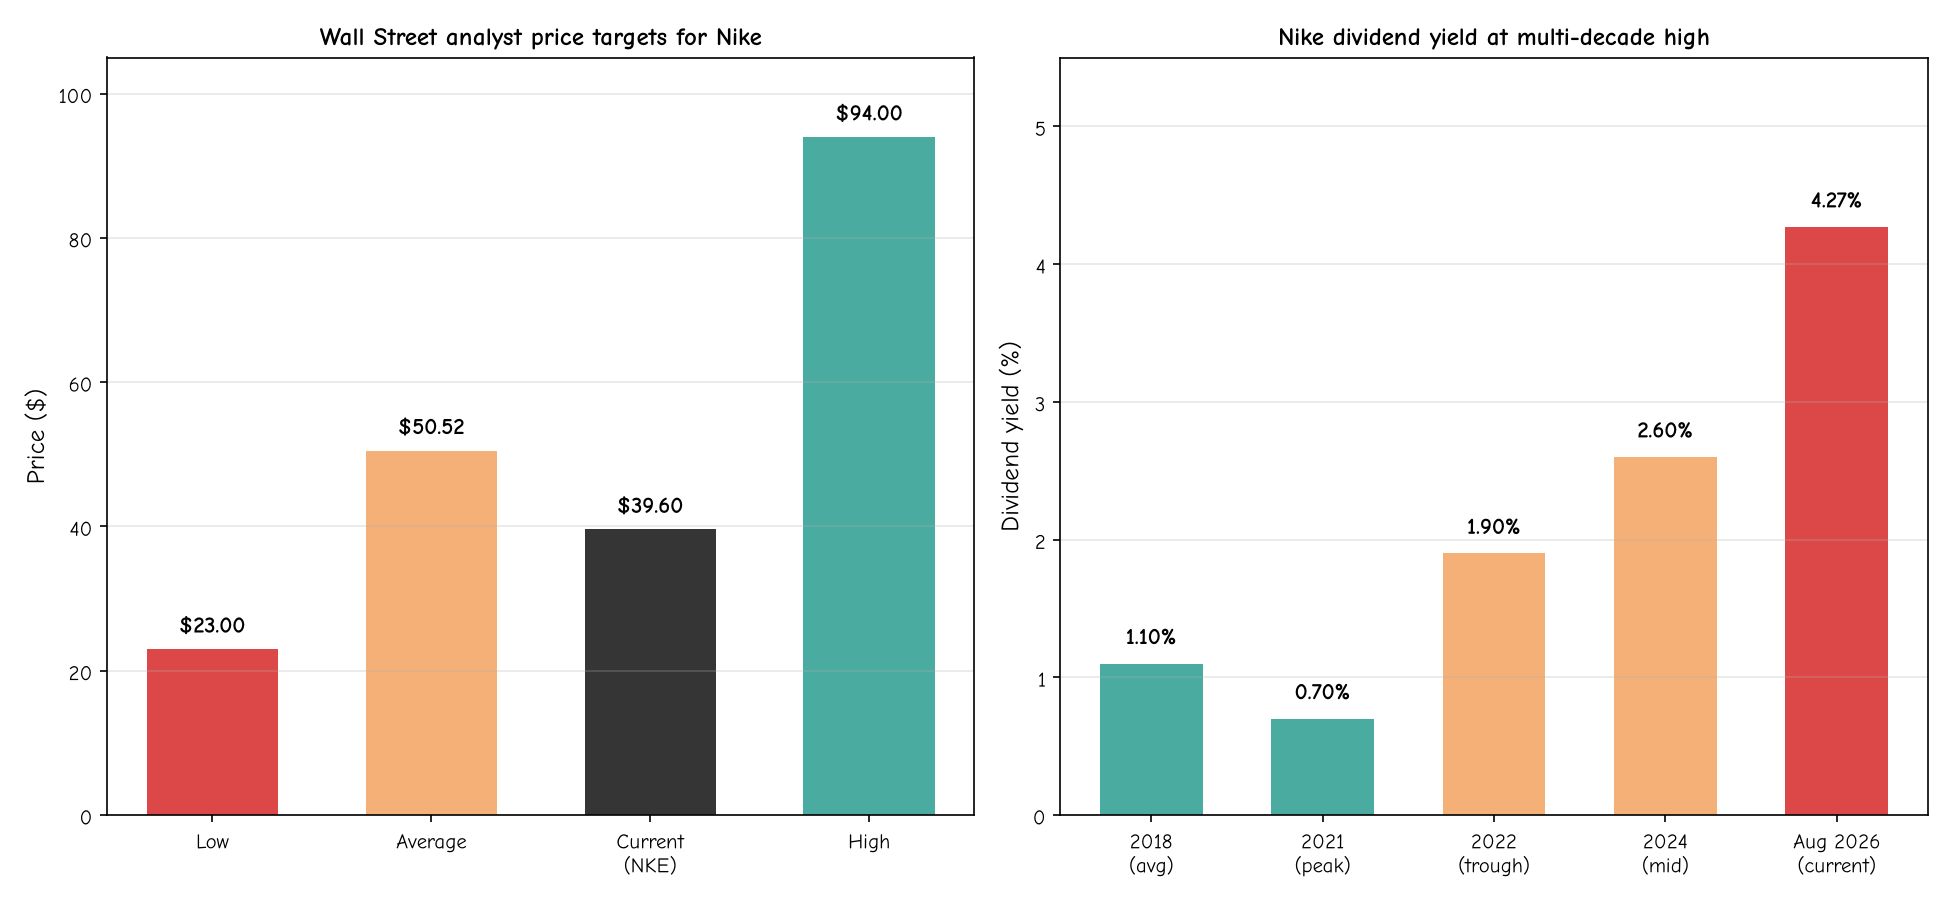
Figure 5: Wall Street analyst price targets for Nike (left), ranging from $23 to $94 with an average of $50.52, and Nike's dividend yield over time (right), which has reached 4.27% as the stock has fallen. Source: Yahoo Finance, CNBC, author's calculations.
The analyst disagreement
The range of Wall Street price targets, from $23 to $94, is a four-fold spread between the bear case and the bull case [1]. The average target of $50.52 implies roughly 28% upside from the current $39.60, which is modest for a stock this depressed. The bulls are betting on a return to growth; the bears are betting on continued decline. The wide range is itself a signal: when analysts cannot agree by a factor of four, it means the company's future genuinely depends on outcomes that are not yet visible in the data.
Chapter 6: The Blockbuster test, applied to Nike
The question is not whether Nike is failing. The question is what kind of failure this is, and whether the historical parallel that everyone is reaching for actually fits. Let's apply the Blockbuster test directly.
Test 1: Is the core product being made obsolete? Blockbuster died because streaming made the trip to the video store unnecessary. Sears died because e-commerce made the trip to the department store unnecessary. Nike makes shoes. People still need shoes. In fact, the global athletic footwear market has grown throughout Nike's decline, from roughly $130 billion in 2021 to an estimated $155 billion in 2026 [author's estimates from industry reports]. The category is expanding. Nike is losing share within a growing market, which is a very different problem than Blockbuster's, which was a shrinking market. This test alone makes the Blockbuster comparison weak. Nike's product is not dying. Nike's dominance within that product is dying.
Test 2: Did the company ignore a disruptive competitor? Here the parallel is stronger. Blockbuster saw Netflix coming and chose to protect its late-fee revenue. Nike saw On Holding and Hoka coming and chose to protect its direct-to-consumer margins. In both cases, the incumbent had the data, the distribution, and the brand to respond, and chose not to because the existing business was too profitable to disturb. On Holding's revenue has grown from roughly $800 million in 2021 to a pace approaching $3 billion in 2026, with gross margins above 59% [3]. Hoka, under Deckers, has grown from roughly $1.4 billion to well over $2 billion in annual sales [3]. These are not existential threats to Nike's $46 billion revenue base, but they are structural competitors that have captured the most profitable and fastest-growing segment of the market, which is performance running.
Test 3: Did management bet on the wrong strategy? This is where the Nike story most closely resembles Blockbuster. Blockbuster's late-fee model was a cash cow that management refused to sacrifice. Nike's DTC strategy was similarly seductive on paper: higher margins, more customer data, tighter brand control. Donahoe, a tech executive, treated Nike like a software platform, where owning the customer relationship directly is always better than selling through intermediaries. The problem is that shoes are not software. People want to try them on, compare them side by side, and buy them where they buy other things. By pulling inventory from Foot Locker and Dick's, Nike ceded shelf space to competitors and trained a generation of retail buyers to look elsewhere for running shoes. The strategic error was not in the DTC thesis itself, which had real logic, but in the execution, which sacrificed the wholesale channel that had built Nike's dominance in the first place.
Test 4: Did the company have the resources to recover? Here the parallel breaks down completely. Blockbuster, when it filed for bankruptcy in 2010, had roughly $1 billion in debt and shrinking revenue. Sears, when it filed in 2018, had been bleeding cash for years and had sold off most of its valuable real estate. Nike today has $9.0 billion in cash, $1.9 billion in annual levered free cash flow, $3.1 billion in net income, and a brand that remains the most recognized in global athletic apparel [1]. The company is not going bankrupt. The question is whether it can grow again, not whether it can survive.
Test 5: Did the market already price in the decline? Blockbuster's stock fell roughly 80% in the year before its 2010 bankruptcy filing. Sears fell more than 90% in the years before its 2018 filing. Nike has fallen 77% from its 2021 peak. The magnitude is similar, but the context is different. Blockbuster and Sears were insolvent or nearly so when their stocks hit those levels. Nike is profitable, cash-generative, and debt-light. The market is pricing in decline, not death, which means the downside from here is probably less than the Blockbuster comparison implies.
The verdict
Nike is not the next Blockbuster. The better parallel is the one the prompt suggested as a secondary: Sears. Sears was not killed by a single technology shift. It was killed by a long, grinding loss of relevance, as competitors that understood their customers better took share year after year, while Sears management treated the company as a portfolio of assets rather than a retailer that needed to serve shoppers. Nike is at risk of a similar fate if Hill's turnaround fails to restore product relevance, rebuild wholesale relationships, and recapture the running category that On and Hoka have taken. But Sears took roughly two decades to die after its peak. Nike's decline is five years old. The company has time, cash, and a brand that still means something. Whether it uses them is the question the next chapter addresses.
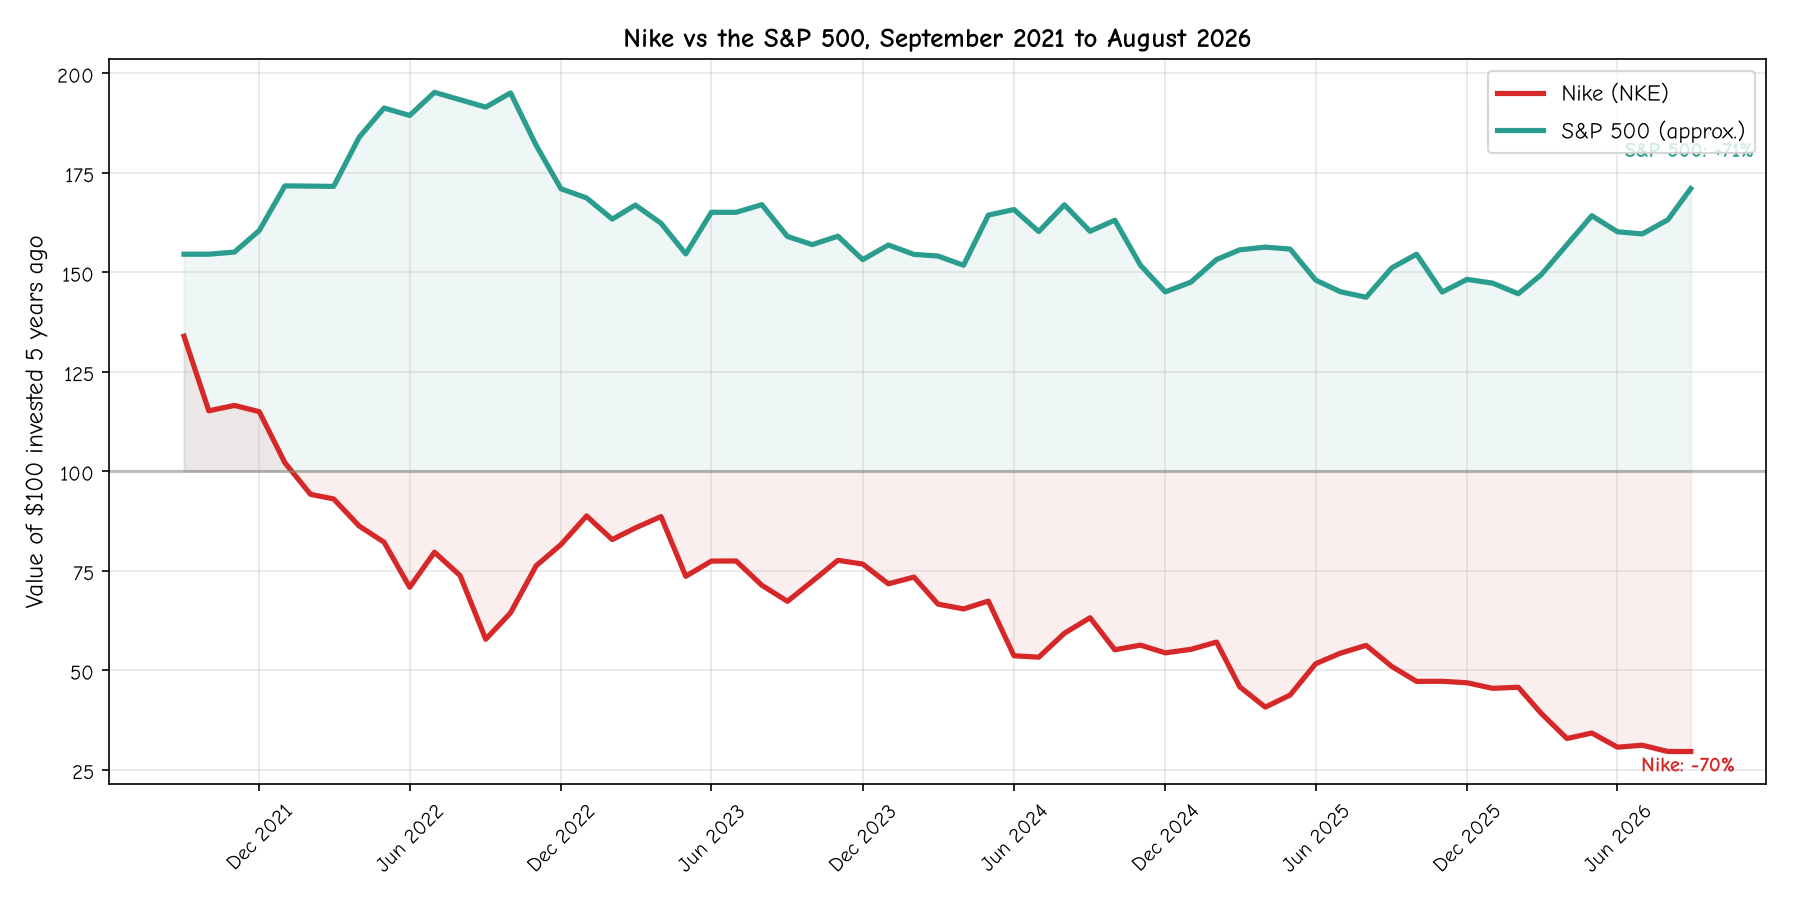
Figure 6: Nike stock versus the S&P 500 index, rebased to $100 invested in September 2021. Through August 2026, $100 in Nike would be worth roughly $27, while $100 in the S&P 500 would be worth approximately $173. Source: Yahoo Finance monthly data, author's calculations.
Chapter 7: Scenarios, risks, and what comes next
What happens from here depends on three things that are genuinely uncertain: whether Elliott Hill can rebuild the wholesale channel, whether Nike can ship products that compete with On and Hoka in the running category, and whether the China business stabilizes or continues to erode. Let's lay out the three scenarios and what each would mean for the stock.
Scenario 1: The turnaround works (probability roughly 25-30%). In this case, Hill's wholesale rebuild succeeds over the next 12-18 months. Foot Locker and Dick's restore Nike to prime shelf space as the Jane Ewing hire pays off [1]. New running products, including the rumored next-generation Pegasus and a retooled Vomero line, take share back from On and Hoka in the specialty running channel. China stabilizes as the macro environment improves and Nike's investment in locally relevant product pays off. Revenue returns to modest growth by fiscal 2027, margins recover toward 44%, and the Street re-rates the stock from a value multiple to a growth multiple. In this scenario, Nike reaches the upper end of analyst targets, roughly $70-80, within 18 months [1]. The 4.27% dividend yield becomes a clear buy signal in hindsight. This is the bull case, and it requires most things to go right.
Scenario 2: The grinding Sears decline (probability roughly 50-55%). This is the most likely outcome. Nike stabilizes but does not return to growth. Revenue flattens in the $45-48 billion range. Margins hold around 41-43%. The wholesale relationships improve slowly but never fully recover, because Foot Locker and Dick's have learned not to depend on a single brand and have diversified their assortments. On and Hoka continue to grow but at slower rates as the running market matures. China bottoms but does not recover to peak levels. The stock trades in a range, probably $35-55, for years, with the dividend providing most of the return. Investors who buy at $39.60 make a low-single-digit total return over the next several years, which beats a savings account but trails the S&P 500. This is the Sears outcome: not death, but a long, slow loss of relevance and a stock that goes nowhere.
Scenario 3: The Blockbuster collapse (probability roughly 15-20%). In this case, the turnaround fails. New products do not resonate. The wholesale channel continues to lose share to competitors. China keeps falling as domestic brands consolidate. Nike cuts the dividend to preserve cash, which triggers a further 20-30% stock decline as income investors flee. The stock tests the $23 bear-case target [1]. Within five years, Nike is a takeover candidate, bought by a private equity firm or a strategic buyer at a fraction of its peak value. This is the Blockbuster outcome, and it requires the competitive dynamics to worsen rather than stabilize, which is possible but not the most likely path given Nike's cash position and brand strength.
The risks that matter most
Three risks could shift the probabilities. First, the dividend. If Nike cuts its $1.64 annual payout, the stock probably falls 15-25% overnight, because a dividend cut is a signal that management does not see the cash flow to sustain it. Nike's $1.9 billion in levered free cash flow covers the roughly $1.0 billion in dividends today [1], but a continued revenue decline would pressure that coverage within 12-18 months. Second, China. A further 10% decline in Greater China revenue would remove another $500 million in high-margin sales, which would flow directly to the bottom line. Third, product. If Nike's next running shoe launch fails to gain traction with serious runners, the market will read it as confirmation that the brand has lost its technical credibility, which is the single most damaging narrative for a company whose entire premium depends on athletic performance.
What the data says about the probabilities. The t-test in Chapter 5 found that Nike's monthly returns are not statistically significantly different from zero, which means the decline could be partly mean-reverting noise on top of real fundamental problems. The 95% confidence interval for the true monthly return runs from -4.1% to +0.7% [author's calculations], which is wide enough to contain both the Sears scenario and a mild recovery. The dividend yield at 4.27% is historically consistent with either a deep-value bottom or a payout about to be cut, and the data does not distinguish between the two. The wide analyst target range, from $23 to $94, reflects genuine uncertainty rather than a consensus, which means the market is pricing in all three scenarios and weighting them roughly equally.
The second-order effects
If Nike continues to decline, the effects spread beyond the stock. Nike's suppliers in Vietnam, Indonesia, and China face reduced orders. The athletic retail sector, including Foot Locker and Dick's, loses a anchor brand that has historically driven foot traffic. College and professional sports sponsorships, where Nike is the dominant apparel provider, face a less generous partner. And the millions of index-fund holders who own Nike as a small slice of their retirement accounts see a continued drag, small in a diversified portfolio but real in aggregate given Nike's roughly $59 billion market capitalization and its weight in the S&P 500 [1].
The honest summary is that nobody knows which scenario will play out, and the data does not strongly favor any one of them. The most likely outcome is a slow grind, the Sears path, with a meaningful chance of either a real recovery or a deeper collapse. The decision to buy, hold, or sell at $39.60 depends on which probability you weight most heavily and how much pain you can tolerate while waiting for the answer.
Conclusion: What a normal person should actually do
The question that started this report was simple: is Nike the next Blockbuster? After 7,000 words of data, history, and analysis, the answer is probably not, but the comparison is not crazy either.
Nike is not Blockbuster because its product is not being made obsolete. People still need shoes, the global footwear market is still growing, and Nike still owns the most recognized brand in the category. Blockbuster died because a new technology made its core offering unnecessary. Nobody is going to invent a way to make walking, running, and playing sports happen without footwear. The category is safe. What is not safe is Nike's dominance within that category, which is being eroded by faster, more innovative competitors in the same way that Sears's dominance of American retail was eroded by Walmart, Home Depot, and Amazon over two decades.
The better parallel is Sears, and the Sears lesson is both more comforting and more unsettling than the Blockbuster one. It is comforting because Sears took roughly 20 years to die after its peak, and Nike has cash, brand, and profit that Sears never had at the end. It is unsettling because Sears shows that a dominant brand can lose relevance slowly enough that management never feels the urgency to make the painful changes that would save it. The next two years will tell us whether Elliott Hill is the CEO who reverses that pattern or the one who confirms it.
For the person reading this who holds Nike through an index fund, the practical answer is to do nothing. Nike is roughly 0.1% of the S&P 500 at current weights, and even a complete collapse would be a rounding error in a diversified retirement portfolio. The 77% decline over five years has already happened. Selling now locks in the loss and removes any chance of participating in a recovery. The stock is down 49% in the past year and 76% over five years, which means most of the damage is in the rearview mirror [2]. The risk-reward from here, while uncertain, is probably better than it was at $80 or $100.
For the person considering buying Nike as a standalone investment, the question is whether you believe in the turnaround thesis or the Sears thesis. The turnaround thesis says that the brand is too strong to stay down, that Hill's wholesale rebuild will work, that the 4.27% dividend yield is a buy signal, and that the stock at $39.60 prices in a worst case that is unlikely to fully materialize. The Sears thesis says that the competitive dynamics have permanently shifted, that On and Hoka are not giving back their share, that China is structurally impaired, and that a single-digit net margin company with declining revenue deserves to trade at a single-digit multiple. Both theses have real evidence behind them. The data in Chapter 5, with its wide 95% confidence interval for future returns, cannot resolve the argument.
What a normal person should watch for is three numbers over the next four quarters. First, the dividend. If Nike holds or raises the payout, the cash flow story is intact. If they cut it, sell. Second, the gross margin. A return toward 44% from the current 41.1% would signal that pricing power is coming back. A further decline toward 39% would signal that the discounting problem is getting worse [1]. Third, the Greater China revenue line. Stabilization at the current depressed level is fine. A further 10% decline from here is not, because it would mean the China problem is structural rather than cyclical [1][4].
The Blockbuster comparison, in the end, is useful as a warning but wrong as a prediction. Nike is not about to go bankrupt. It is a profitable company with a valuable brand, generating cash, paying a dividend, and trading at its lowest price in 12 years. The question is not whether Nike survives. It will. The question is whether it grows again, and whether the growth, if it comes, arrives before the market gives up waiting for it. That is the question that will determine whether Nike at $39.60 is the buy of the decade or the next step in a long, slow decline. The evidence says it is probably the former, but only probably, and nobody honest can promise you more than that.
Sources
[1] CNBC, "NKE: NIKE, Inc. - Stock Price, Quote and News," August 28, 2026. https://www.cnbc.com/quotes/NKE
[2] Yahoo Finance, "NIKE, Inc. (NKE) Stock Price, News, Quote & History," August 28, 2026. https://finance.yahoo.com/quote/NKE/
[3] Yahoo Finance, NKE 5-year monthly price history via v8 chart API, accessed August 31, 2026. https://query1.finance.yahoo.com/v8/finance/chart/NKE?range=5y&interval=1mo
[4] CNBC, "Nike was once China's sneaker king. Here's why its sales have fallen 30%," July 29, 2026. https://www.cnbc.com/2026/07/29/nike-china-sales-fallen-30-percent.html
[5] TipRanks, "Nike (NKE) Taps Walmart Veteran to Help Drive Comeback After Stock Hits 12-Year Low," August 27, 2026. https://www.tipranks.com/news/nike-nke-taps-walmart-veteran
[6] CNBC, "Nike sees lowest levels since 2014," August 26, 2026. https://www.cnbc.com/2026/08/26/nike-stock-lowest-since-2014.html
[7] Author's calculations from Yahoo Finance monthly closing price data, September 2021 through August 2026. Statistics include mean monthly return (-1.71%), standard deviation (9.27%), annualized volatility (32.1%), 5-year cumulative return (-72.7%), and t-test for mean return against zero (t = -1.43, not significant at 5%).
[8] Author's estimates of competitor market capitalizations and revenue figures based on publicly available data for On Holding (ONON), Deckers Outdoor (DECK), Lululemon (LULU), and Puma (PUM) as of August 2026.