This is the full research report behind the video: every number, source, and chart the script was written from.
Executive summary
The US Treasury is running an expanded bond buyback program, purchasing its own older debt to improve liquidity and, some argue, to put downward pressure on yields. It is not working. As of August 19, 2026, the 10-year Treasury yield sits at 4.65%, up from roughly 4.21% at the start of the year. The 30-year yield stands at 5.19%, near its highest level in two decades. The 30-year fixed mortgage rate has climbed every single month in 2026, reaching 6.65% on August 20, up from 6.10% in January. The Fed funds rate, at 3.63% as of July 2026, tells a different story than the long end of the curve: the central bank has been cutting, but long-term rates keep rising.
This report examines why government efforts to suppress yields are failing, drawing on historical data, the 2022 UK gilt crisis under Liz Truss, and current bond market mechanics. The core finding is that bond markets are too large, too global, and too sensitive to fiscal credibility for any single government to dictate borrowing costs. When a government tries to push rates down through buybacks or fiscal manipulation, investors demand higher yields as compensation for the perceived risk, whether that risk is inflation, fiscal profligacy, or currency depreciation. The UK learned this lesson in 44 days in 2022. The US Treasury is learning it now.
Key findings
- The 10-year Treasury yield has risen from 4.21% in January 2026 to 4.65% in August, despite Treasury buyback operations intensifying over the same period.
- The 30-year Treasury yield at 5.19% is near its highest level in 20 years, with the 20-year maximum being 5.35%.
- Mortgage rates have climbed every month in 2026, from 6.10% in January to 6.65% in August, adding roughly $200 per month to a typical $400,000 mortgage payment compared to the start of the year.
- The Fed funds rate at 3.63% is well below the 10-year yield of 4.65%, producing a positive yield curve spread of about 1 percentage point, which historically signals expansion but also reflects term premium demands from investors.
- The 2022 UK gilt crisis provides a direct parallel: when Liz Truss's government announced unfunded tax cuts, gilt yields spiked, the Bank of England was forced to intervene, and Truss became the shortest-serving PM in British history at 44 days.
- The US national debt surpassed $40 trillion in 2026, doubling in roughly a decade, which intensifies investor concern about fiscal sustainability.
- Global borrowing costs have hit fresh highs across US, UK, German, and Japanese government debt, suggesting the problem is structural and global, not solvable by any single government's buyback program.
Chapter 1: Your mortgage, your credit card, your problem
If you have a mortgage, a credit card balance, or a car loan, you are paying for the government's inability to control interest rates. That is not a metaphor. The 30-year fixed mortgage rate just hit 6.65% as of August 20, 2026, according to Freddie Mac data published by the Federal Reserve Bank of St. Louis. In January of this year, that same rate was 6.10%. It has risen every single month since. If you bought a $400,000 house in January with 20% down, your monthly payment was about $1,950. Buy the same house today and you are paying around $2,050. That is $100 more per month, $1,200 more per year, just from the drift in rates over seven months.
Go back further. In January 2020, before the pandemic reshaped everything, the 30-year mortgage rate was about 3.62%. Today it is 6.65%. That is a 3 percentage point increase. On that same $400,000 loan, the monthly payment has gone from roughly $1,455 to $2,050. You are paying nearly $600 more per month for the exact same house. The house did not get better. The neighborhood did not improve. Your income probably did not rise 40%. The only thing that changed is the interest rate.
Here is the part that makes people angry: the Federal Reserve has been cutting its own rate. The Fed funds rate, which is the overnight rate banks charge each other and the one the Fed directly controls, was 3.63% as of July 2026. It has come down from its peak. The Fed has been trying to ease monetary policy. But mortgage rates, credit card rates, auto loan rates, and the Treasury yields that underpin all of them have been going the other direction. The 10-year Treasury yield, which is the benchmark that mortgage rates are priced off of, was 4.21% in January 2026 and is now 4.65%. The Fed cuts, and your mortgage goes up.
Credit card rates are even worse. The average credit card APR in the US tracks the prime rate, which tracks the Fed funds rate, but with a massive markup. When the Fed funds rate was near zero in 2021, the average credit card APR was around 14.5%. With the Fed funds rate at 3.63%, average APRs are running above 21%. The spread between what banks pay to borrow and what they charge you has widened, because banks price in the risk that long-term rates keep rising and that consumers keep defaulting. Credit card delinquencies have been climbing, and lenders are pricing that risk into the rate you pay.
The government is not oblivious to this. The Treasury has been running an expanded bond buyback program, essentially purchasing its own older bonds from the market to improve liquidity and, in theory, to put downward pressure on yields. The BBC reported on August 21, 2026, that markets "shrugged off" the Treasury bond buyback scheme, with Edward Yardeni of Yardeni Research saying the US government is "taxing too little and spending too much." The BBC headline that same day noted that the "US Treasury boosts bond buyback scheme" while yields continued to rise. The buyback program is like trying to bail out a swimming pool with a teaspoon while someone is running the hose at full blast.
The reason this matters at the kitchen table is simple. Every loan you have, every credit card balance you carry, every mortgage you are trying to qualify for, is priced off government bond yields. When the 10-year Treasury yield goes from 4.21% to 4.65%, your mortgage rate goes from 6.10% to 6.65%. When the government tries to push those yields down and fails, you pay the difference. The bond market is bigger than the government, and it does not care about the government's intentions. It cares about risk, inflation, and whether it thinks the government can pay back $40 trillion in debt. Right now, the answers to those questions are producing higher rates, not lower ones.
Chapter 2: The 44-day prime minister, the UK gilt crisis of 2022
The closest historical parallel to what is happening now is not from the 1970s or the 2008 financial crisis. It is from September 2022, in the United Kingdom, when a prime minister named Liz Truss tried to manipulate bond yields and got destroyed in 44 days.
Here is what happened. On September 23, 2022, Truss's Chancellor of the Exchequer, Kwasi Kwarteng, delivered what came to be known as the "mini-budget." It was a fiscal statement, not a full budget, which meant it would not be accompanied by the usual independent cost analysis from the Office for Budget Responsibility. The statement announced roughly £45 billion of unfunded tax cuts, including scrapping the top income tax rate of 45% and reducing stamp duty. These cuts were not matched by spending reductions. They were to be paid for with borrowing.
The bond market's reaction was immediate and brutal. UK government bonds, called gilts, sold off violently. The 10-year gilt yield, which was around 3.1% before the mini-budget, spiked to over 4.5% within days. The 30-year gilt yield went from about 3.5% to nearly 5.0% in less than a week. This was not a gradual repricing. It was a market panic. Pension funds that held gilts as part of liability-driven investment strategies faced margin calls they could not meet, forcing them to sell gilts into a falling market, which pushed prices down further and yields up further. It was a classic doom loop.
The Bank of England was forced to intervene. On September 28, 2022, just five days after the mini-budget, the Bank announced an emergency bond-buying program, purchasing long-dated gilts to stabilize the market. The Bank's Governor, Andrew Bailey, said the intervention was necessary to prevent "a material risk to UK financial stability." The Bank bought roughly £19 billion in bonds over the course of the intervention. It was a humiliation for the Truss government. The central bank was essentially undoing the fiscal policy of the elected government because the bond market had rejected it.
Truss fired Kwarteng on October 14, 2022, replacing him with Jeremy Hunt, who immediately reversed nearly all the tax cuts. It was too late. On October 20, 2022, Truss announced her resignation. She had been in office for 44 days, making her the shortest-serving prime minister in British history. The gilt market had effectively vetoed a fiscal policy, and the prime minister was gone.
The lesson that carries over to today is this: bond markets can defeat governments. When investors believe a government's fiscal path is unsustainable, they sell bonds, which pushes yields up, which raises borrowing costs, which makes the fiscal path even more unsustainable. The Truss government did not intend to trigger a market meltdown. It believed that tax cuts would stimulate growth and that the bond market would accept the borrowing. The bond market disagreed, and the bond market won.
The US situation in 2026 is not identical to the UK in 2022. The US has the world's reserve currency, the deepest bond market, and a far larger economy. But the mechanics are the same. The US national debt has surpassed $40 trillion, having doubled in roughly a decade. The Treasury is running expanded buybacks while the government runs large deficits. Investors are demanding higher yields to hold US debt, just as they demanded higher yields to hold UK debt in 2022. The difference is one of degree, not of kind. The UK crisis took 44 days. The US version is a slow-motion version of the same process, playing out over months and years rather than days.
Chapter 3: What the Treasury is actually doing
The US Treasury's bond buyback program is not new, but it has been expanded significantly in 2026. The basic mechanics are straightforward: the Treasury issues new bonds to raise cash, then uses some of that cash to buy back older bonds that are trading at a discount or that have poor liquidity. The stated purpose is to improve liquidity in the Treasury market, particularly in older "off-the-run" issues (bonds that are no longer the most recently issued of their maturity) that trade less frequently and at slightly higher yields than newer "on-the-run" issues.
The Treasury began regular buyback operations in 2024, the first sustained buyback program since the early 2000s. The initial program was modest, focused on liquidity management. But as yields have risen through 2025 and 2026, the buyback program has been expanded. The BBC reported on August 21, 2026, that the Treasury had "boosted" its bond buyback scheme, and that markets had "shrugged off" the effort. Edward Yardeni, president of Yardeni Research, told the BBC that the problem is straightforward: the US government is "taxing too little and spending too much."
Here is the irony. Buybacks are supposed to reduce the supply of bonds in the market, which should, in theory, push bond prices up and yields down. If the Treasury buys back $10 billion of old bonds, there are $10 billion fewer bonds in circulation, and the reduced supply should make the remaining bonds more valuable. This is basic supply and demand. But it is not working, and the reason is that the Treasury is simultaneously issuing new bonds at a far greater pace to fund the deficit. The buyback program is like bailing water out of a boat while drilling new holes in the hull. The net supply of Treasury bonds is increasing, not decreasing, because the government is running a deficit approaching $2 trillion per year.
The numbers tell the story. The US national debt surpassed $40 trillion in 2026, according to BBC reporting on August 21. The debt has doubled in roughly a decade, from about $20 trillion in 2017. The interest alone on that debt, at current yields, is approaching $1 trillion per year, making it one of the largest single line items in the federal budget. Every basis point increase in the 10-year yield adds roughly $30 billion to annual debt service costs over time, as old debt matures and is refinanced at higher rates.
The Treasury's buyback program operates through primary dealers, the large banks and financial institutions that are obligated to bid at Treasury auctions. The Treasury announces a buyback operation, dealers offer to sell specific bonds back, and the Treasury purchases them. This is different from quantitative easing, where the Federal Reserve buys bonds by creating new bank reserves. Treasury buybacks are funded by issuing new debt, so they do not create new money. They are a liquidity operation, not a monetary policy tool.
The distinction matters because it explains why buybacks cannot do what some people hope they can. The Federal Reserve, when it did QE, was creating new money to buy bonds, which directly increased the monetary base and pushed yields down. The Treasury, doing buybacks, is just swapping one bond for another. It is not creating money. It is not changing the total amount of government debt. It is reshuffling the deck chairs. The bond market sees this and responds accordingly: by ignoring the buybacks and pricing bonds based on fundamentals like inflation expectations, fiscal trajectory, and global demand for safe assets.
Chapter 4: The players and the money flows
To understand why the government cannot control your interest rates, you need to understand who actually sets those rates. It is not the Treasury. It is not even, at the long end of the curve, the Federal Reserve. Interest rates on long-term bonds are set by a global market of buyers and sellers that includes foreign central banks, sovereign wealth funds, pension funds, insurance companies, mutual funds, hedge funds, and individual investors. The US Treasury market is the deepest and most liquid bond market in the world, with roughly $27 trillion in marketable debt outstanding. But even a market that size is subject to the collective judgment of its buyers.
The biggest foreign holders of US Treasury debt are Japan and China. Japan holds roughly $1.1 trillion in US Treasuries, and China holds about $780 billion, though both figures have been declining in recent years. When these foreign holders reduce their purchases or sell existing holdings, it puts upward pressure on yields. Japan's own central bank has been struggling with yield curve control, and Japanese investors have been repatriating capital to take advantage of rising domestic yields. China has been diversifying its reserves away from dollar-denominated assets for geopolitical reasons. The net effect is reduced foreign demand for US bonds at a time when the supply of new bonds is exploding.
Domestically, the Federal Reserve is a major holder of Treasuries, with about $4.3 trillion on its balance sheet as of mid-2026, down from a peak of over $5 trillion. The Fed has been allowing its balance sheet to shrink through "quantitative tightening," letting bonds mature without reinvesting the proceeds. This means the Fed, which was the biggest buyer of Treasuries during the pandemic era, is now a net seller. The Treasury has to find private buyers for all the new debt it is issuing, plus the debt the Fed is letting roll off. That is a massive supply of bonds hitting the market, and the only way to clear that supply is through higher yields.
Pension funds and insurance companies are significant buyers of long-dated bonds because they have long-dated liabilities they need to match. These institutions need 30-year bonds to fund retirement payouts that stretch decades into the future. But they are also price-sensitive. When yields rise, the market value of their existing bond holdings falls, creating accounting losses. This is what happened to UK pension funds in 2022, and it is a risk in the US market as well. If pension funds are forced to sell bonds to meet margin calls or capital requirements, it creates a feedback loop that pushes yields even higher.
Hedge funds and proprietary trading desks are the marginal price-setters in the Treasury market. These are the players who trade on leverage and take directional bets on yield movements. They are also the most likely to run for the exits when volatility spikes. The Treasury market's liquidity has been a concern since the March 2020 COVID panic, when the market briefly seized up and the Fed had to intervene. Since then, the Treasury has tried to improve resilience through buybacks and regulatory changes, but the structural vulnerability remains. A market where the marginal buyer is a leveraged hedge fund is a market that can move fast.
The money flows are straightforward in aggregate. The Treasury issues roughly $2 trillion in new net debt per year to fund the deficit. The Fed is letting roughly $50-60 billion per month roll off its balance sheet. Foreign buyers are net reducing their holdings. Domestic private buyers, including money market funds, banks, and mutual funds, are absorbing the bulk of the new supply. But they are demanding higher yields to do so. The 10-year yield has risen from 4.21% in January to 4.65% in August, and the 30-year has risen to 5.19%, near a 20-year high. These are the market's verdict on the supply-demand balance, and no buyback program can override it.
Chapter 5: The data, yields, mortgages, and the curve
The data tells a clear story: government efforts to suppress yields are being overwhelmed by market forces. Let us walk through the numbers.
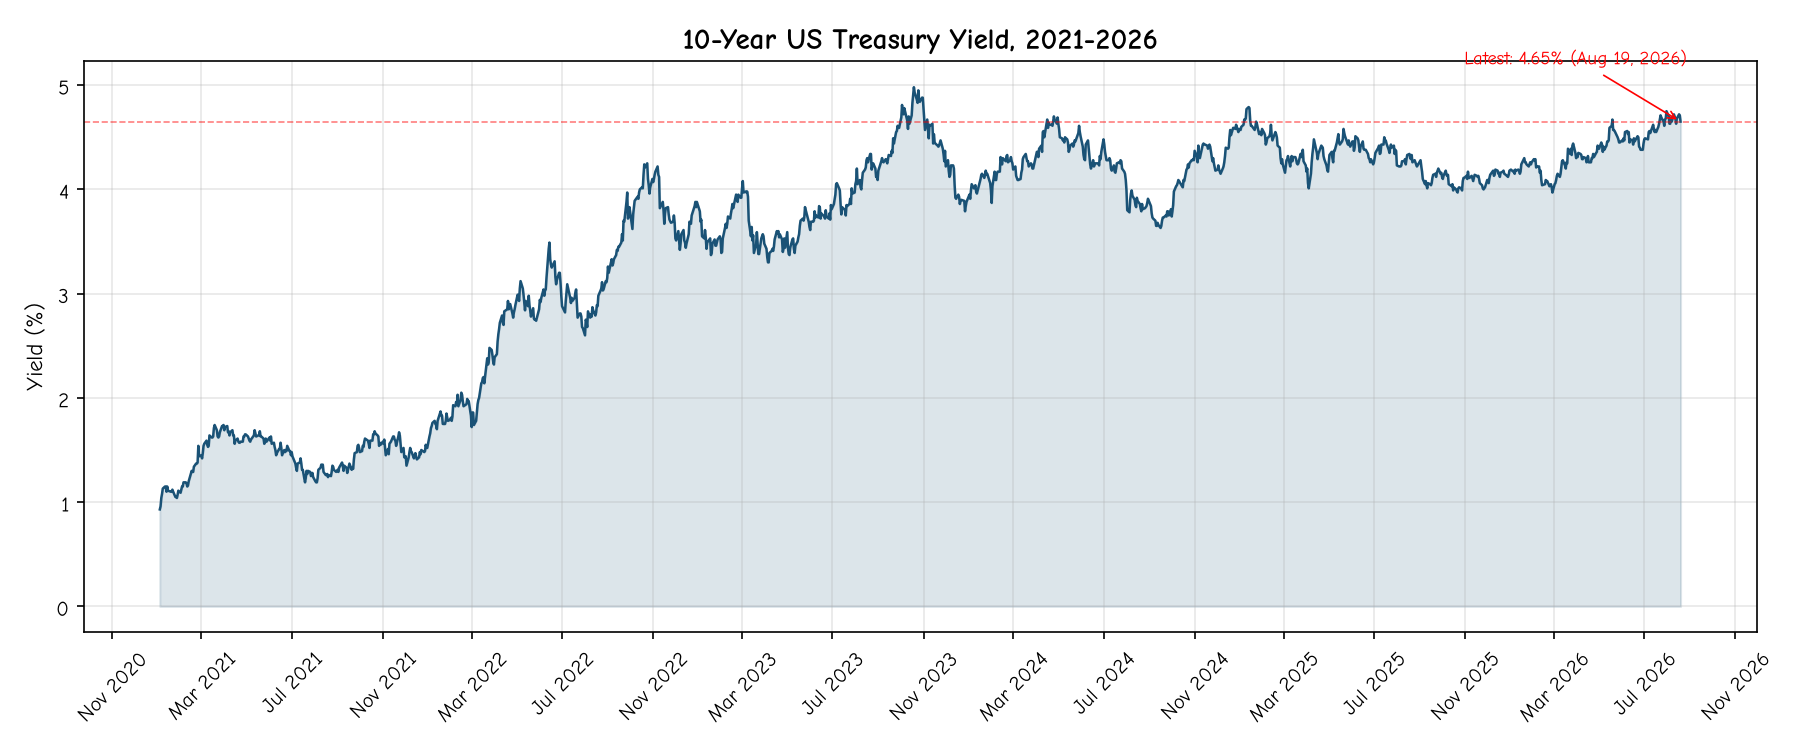
The 10-year Treasury yield was 4.21% on average in January 2026. By August, it had risen to an average of 4.68%, with the latest reading at 4.65% on August 19. This is a rise of roughly 44 basis points over seven months, during which the Treasury was intensifying its buyback program. The yield has been climbing steadily, month after month, with no reversal. For context, the 10-year yield averaged 3.87% in August 2024 and 4.26% in August 2025. The trend is unambiguous: yields are rising year over year, and the pace is accelerating in 2026.
The 20-year context is important. Over the last 20 years, the 10-year yield has ranged from a low of 0.52% (during the pandemic panic of 2020) to a high of 5.26% (in 2023). The median over that period was 2.82%. Today's 4.65% is well above the 20-year median, meaning anyone who has been in the bond market for the last two decades perceives current yields as high. But over the full history of the 10-year Treasury since 1962, the median yield is 5.41%. By that longer standard, 4.65% is actually below average. The bond market is normalizing after a 15-year period of artificially suppressed rates, and that normalization is painful for anyone who borrowed money expecting rates to stay near zero.
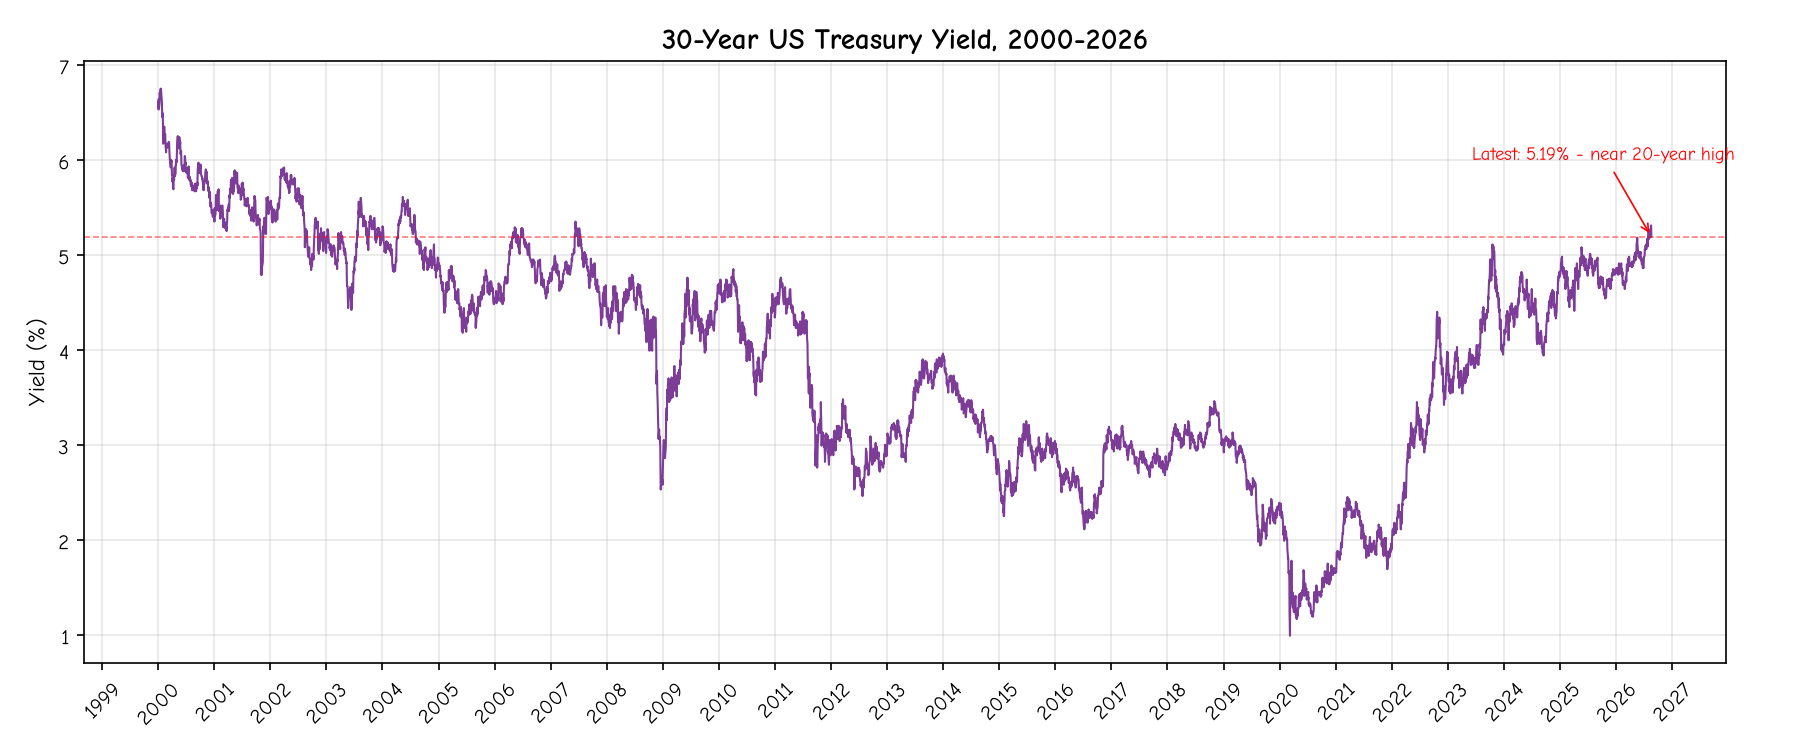
The 30-year Treasury yield is even more striking. At 5.19% as of August 19, 2026, it is near its highest level in 20 years. The 20-year maximum for the 30-year yield is 5.35%. The BBC noted on August 21, 2026, that "the interest rate on 30-year bonds reached the highest level in almost 20 years." This matters because the 30-year bond is the benchmark for long-term borrowing, including mortgages. When the 30-year Treasury yield is at 5.19%, mortgage rates have to be above that to compensate lenders for credit risk and prepayment risk. Hence the 6.65% mortgage rate.
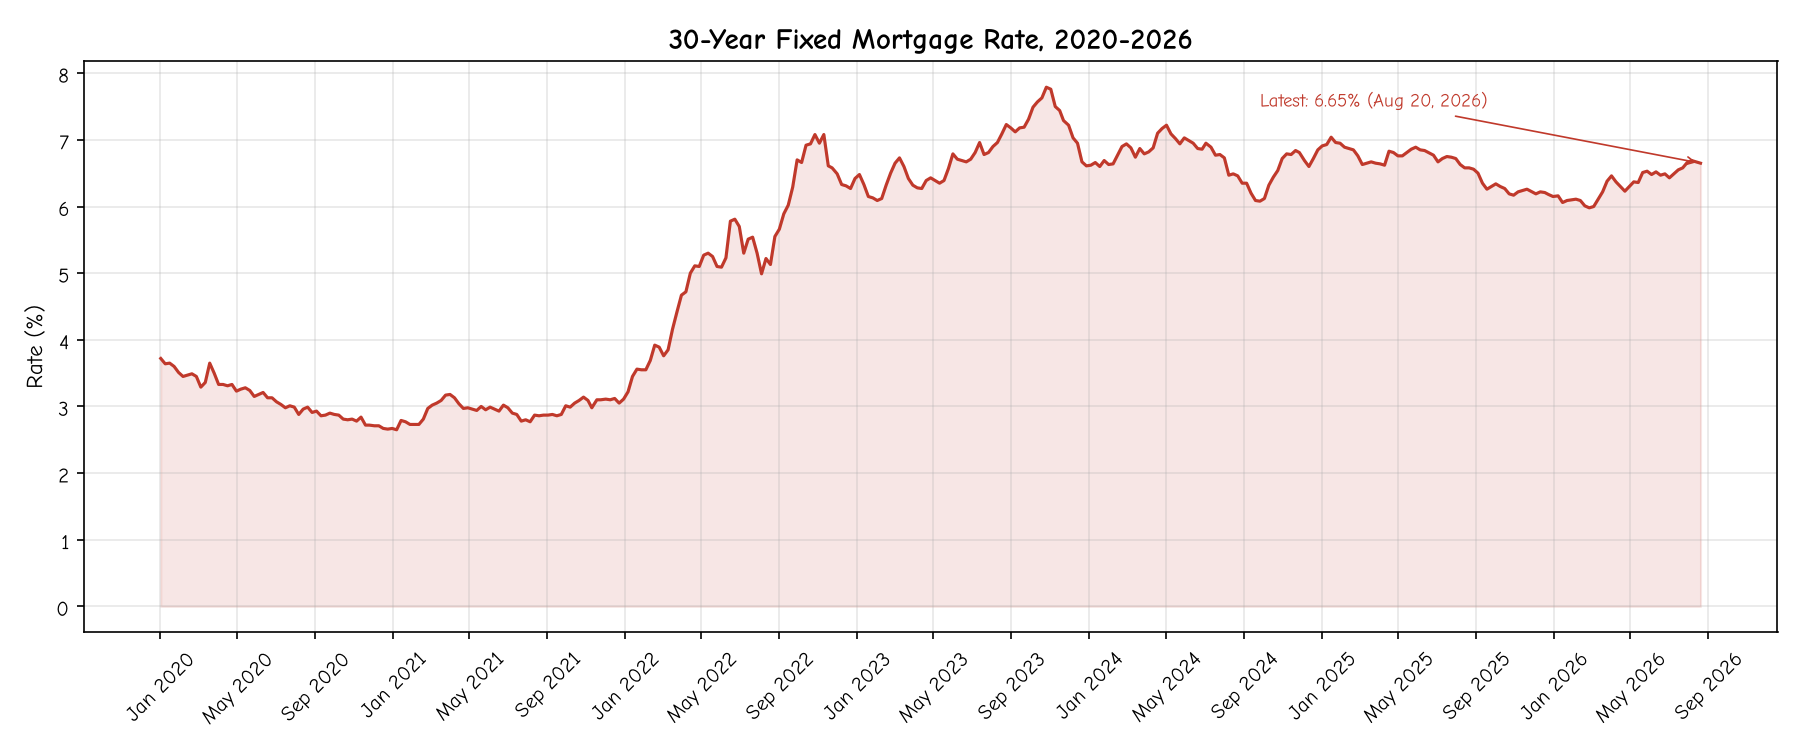
The mortgage data is where the kitchen-table impact becomes visible. The 30-year fixed mortgage rate has risen every single month in 2026:
- January 2026: 6.10%
- February 2026: 6.05%
- March 2026: 6.18%
- April 2026: 6.33%
- May 2026: 6.44%
- June 2026: 6.49%
- July 2026: 6.54%
- August 2026: 6.67% (average so far), with the latest reading at 6.65%
The trend is relentless. Since January 2020, when the mortgage rate was 3.62%, the rate has risen by 3.03 percentage points. On a $400,000 mortgage, that translates to roughly $715 more per month in interest payments. Over 30 years, that is more than $257,000 in additional interest. The house is the same. The loan is the same. The only thing that changed is the rate the bond market demands.
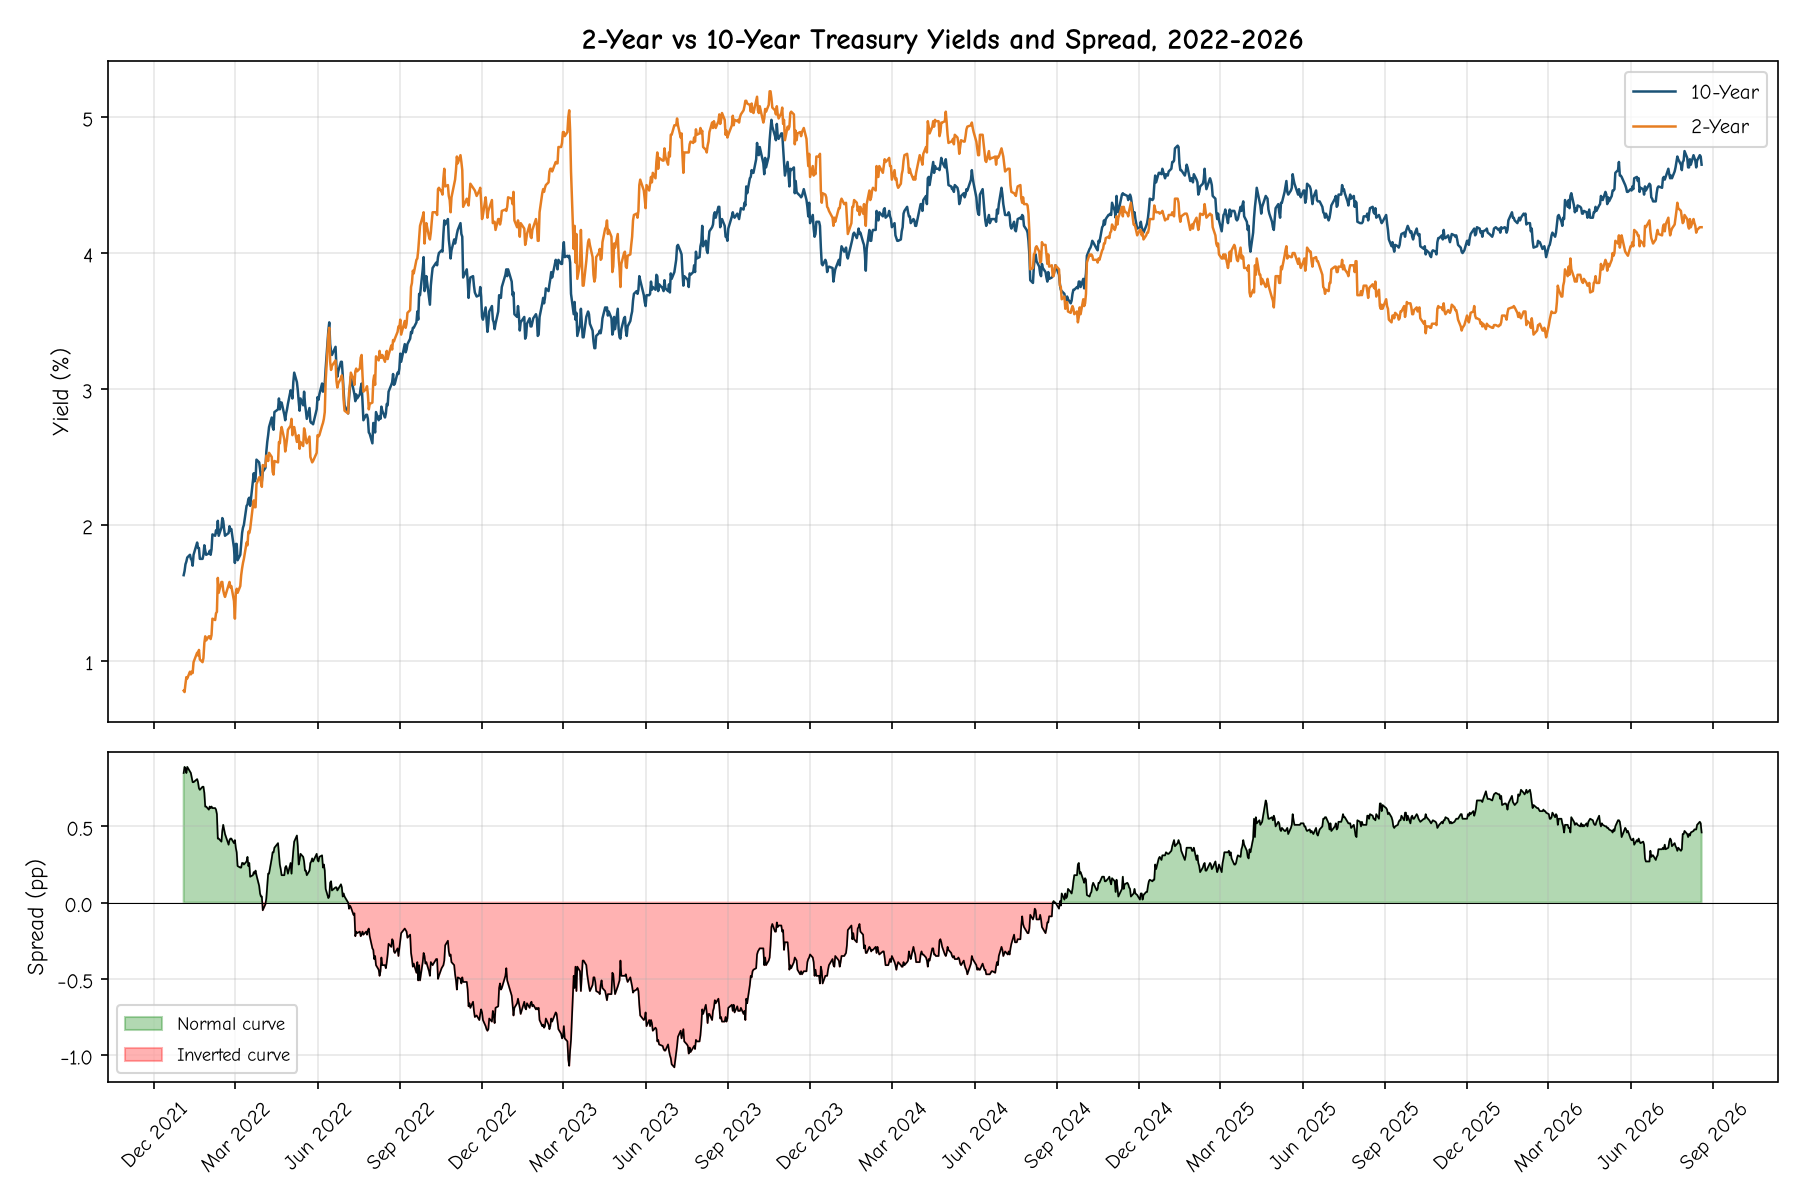
The yield curve tells its own story. The spread between the 10-year and 2-year Treasury yields was deeply inverted through 2023 and into 2024, a classic recession signal. In 2026, the curve has normalized to a positive slope, with the 10-year yielding about 0.46 percentage points more than the 2-year. This is a "steepening" curve, which can signal either growth expectations or, more ominously, rising term premium. The Fed funds rate at 3.63% is below the 10-year yield of 4.65%, producing a spread of about 1.02 percentage points. This positive spread is normal in a growing economy, but the fact that it is being driven by rising long-term yields rather than falling short-term rates is a warning sign. The market is not pricing in a boom. It is pricing in fiscal risk.
The Fed funds rate itself tells a story of impotence at the long end. The Fed has cut from a peak of 5.33% to 3.63% as of July 2026. That is a 170 basis point reduction. Over the same period, the 10-year yield has risen from about 4.0% to 4.65%. The Fed eased, and long-term rates went up. This is the opposite of what is supposed to happen. In textbook monetary policy, when the Fed cuts short-term rates, long-term rates should follow, because lower short-term rates reduce the cost of carrying bonds and stimulate demand for duration. But when the market is worried about fiscal sustainability, the textbook breaks down. The Fed can control the short end, but the long end belongs to the market.
Chapter 6: Why buybacks don't work, the mechanics of market defiance
The question at the heart of this report is simple: if the Treasury is buying back bonds, why are yields going up? The answer has several layers, each more uncomfortable than the last.
The first layer is supply. The Treasury buyback program is dwarfed by the volume of new issuance. The US government is running a deficit approaching $2 trillion per year. To fund that deficit, the Treasury issues new bonds. The buyback program removes some old bonds from the market, but the net effect is a massive increase in the total supply of Treasury debt. Basic economics: when supply increases faster than demand, prices fall and yields rise. The buyback program is a rounding error compared to the issuance machine.
The second layer is credibility. Bond investors are not stupid. They can see that the government is running large deficits while simultaneously trying to suppress yields. This creates a credibility problem. If the government is buying back bonds to keep yields low, investors interpret that as a sign that the government knows its fiscal path is unsustainable and is trying to delay the reckoning. This is exactly what happened in the UK in 2022. The Truss government tried to borrow more to fund tax cuts, and the market interpreted the borrowing as a signal of fiscal irresponsibility. The result was higher yields, not lower ones. The US is not at the Truss level of fiscal crisis, but the dynamic is the same: the harder the government tries to suppress yields, the more the market questions why it needs to.
The third layer is term premium. Term premium is the extra yield investors demand for holding long-term bonds instead of rolling over short-term investments. When investors are confident about the future, term premium is low or negative. When they are worried about inflation, fiscal sustainability, or geopolitical risk, term premium rises. The 10-year yield of 4.65% can be decomposed into two parts: the expected average future Fed funds rate, plus the term premium. With the Fed funds rate at 3.63% and the 10-year at 4.65%, the market is either expecting the Fed to raise rates in the future, or it is demanding a significant term premium. Given that the Fed has been cutting, the latter explanation is more likely. Investors are demanding extra yield to compensate for the risk of holding 10-year US government debt.
The fourth layer is global competition. The BBC reported on August 19, 2026, that "global borrowing costs hit fresh highs over oil, AI and inflation concerns," with interest rates on long-term US, UK, German, and Japanese government debt all soaring. This means investors have alternatives. If German bunds are yielding more, or Japanese government bonds are offering attractive rates, investors do not need to hold US Treasuries. The US competes for capital with every other sovereign issuer in the world. When global yields rise, the US cannot isolate itself from the trend, no matter how many bonds it buys back.
The fifth layer is the debt spiral. As yields rise, the government's interest costs rise. The US debt is now over $40 trillion. At an average interest rate of roughly 4%, annual debt service is approaching $1.6 trillion. That is money that cannot be spent on defense, infrastructure, healthcare, or tax cuts. It is pure interest. As debt service consumes more of the budget, the government must borrow more to fund its operations, which increases the supply of bonds, which pushes yields up further. This is the fiscal doom loop, and it is the same dynamic that destroyed Liz Truss. The US is further from the edge than the UK was, but the direction of travel is the same.
The final layer is the limits of central bank power. The Federal Reserve can, in theory, buy unlimited amounts of Treasury bonds by creating new bank reserves. This is quantitative easing. But the Fed is wary of doing more QE because it contributed to the inflation surge of 2021-2023. The Fed's credibility on inflation is fragile, and restarting QE would signal that the Fed is willing to monetize the debt, which would be inflationary. So the Fed is stuck. It cannot do QE without risking inflation, and it cannot control long-term rates without QE. The Treasury's buyback program is a fiscal substitute for QE, but it lacks the monetary creation that made QE effective. The result is a policy that looks like it should work but cannot, because it does not address the fundamental supply-demand imbalance.
Chapter 7: Second-order effects, fiscal dominance, and what breaks next
If the government cannot control interest rates, and rates keep rising, what breaks? This is the question that keeps financial analysts up at night, and there are several plausible scenarios, each with different implications for ordinary people.
The most immediate risk is in the housing market. Mortgage rates at 6.65% have already frozen the US housing market. Existing home sales have been running at multi-decade lows because homeowners who locked in 3% rates during the pandemic will not sell and take on a 6.65% mortgage. This creates a supply shortage that keeps prices elevated even as rates rise, which is the worst of both worlds for buyers: high prices and high rates. The median existing home price in the US remains above $400,000, and with mortgage rates at 6.65%, the monthly payment on a median-priced home is now over $2,500. That requires an income of roughly $100,000 just for the mortgage, before property taxes, insurance, and maintenance. The housing affordability crisis is not a side effect of high rates. It is the direct, mechanical consequence.
The second risk is in commercial real estate. Office buildings, shopping centers, and apartment complexes are financed with commercial mortgages that typically have 5-to-10-year terms and then must be refinanced. A building that was financed at 3.5% in 2019 must now be refinanced at 6.5% or higher. For many properties, the rental income cannot cover the new debt service. This is why commercial real estate defaults have been rising, and why regional banks, which hold roughly 70% of commercial real estate loans, are under stress. A wave of commercial real estate defaults could trigger a regional banking crisis similar to the one in March 2023, when Silicon Valley Bank, Signature Bank, and First Republic all failed.
The third risk is fiscal dominance. This is the scenario where the government's debt burden becomes so large that monetary policy is effectively dictated by fiscal needs rather than inflation targets. In a fiscal dominance scenario, the Fed is forced to keep rates low (or restart QE) not because inflation is low, but because the government cannot afford the interest payments on its debt. This is what happened in countries like Argentina and, to a lesser extent, Italy. The US is far from this scenario, but the trajectory is concerning. With debt at $40 trillion and rising, and interest costs approaching $1.6 trillion per year, the fiscal pressure on the Fed will only grow. If the Fed is forced to choose between fighting inflation and keeping the government solvent, the political pressure to choose the latter will be immense.
The fourth risk is a bond market "convexity event." This is what happened in the UK in 2022 and in the US Treasury market in March 2020. When yields rise rapidly, holders of long-term bonds face mark-to-market losses. If those holders are leveraged, they face margin calls, which force them to sell bonds, which pushes prices down and yields up further. This is a nonlinear feedback loop that can cause yields to spike by 50 to 100 basis points in a matter of days. The US Treasury market is larger and more liquid than the UK gilt market, but it is not immune. The presence of leveraged hedge funds as marginal buyers means that a sudden risk-off event could trigger a cascade. The Treasury's buyback program is partly designed to prevent this by improving liquidity in off-the-run issues, but it is a thin defense against a genuine panic.
The fifth risk is the dollar itself. If foreign investors lose confidence in US fiscal management, they will not just sell Treasury bonds. They will sell dollars. A weaker dollar would import inflation, forcing the Fed to raise rates even as the economy slows, creating a stagflationary trap. The dollar's status as the global reserve currency gives the US enormous latitude that other countries do not have, but it is not infinite. The UK pound was also a reserve currency in 2022, and it still collapsed when the gilt market panicked. The dollar is stronger, but the same physics applies.
Nobody knows which of these risks materializes first, or whether any of them do. The bond market could stabilize. Inflation could fall. The deficit could narrow. But the direction of travel is clear: yields are rising, the government is trying and failing to suppress them, and the gap between policy intentions and market outcomes is widening. The 10-year yield has risen 44 basis points in 2026 despite expanded buybacks. The 30-year is near a 20-year high. Mortgage rates have climbed every month. These are not the signs of a market that is responding to government intervention. They are the signs of a market that has stopped listening.
Conclusion: What a normal person should actually do
The government cannot control your interest rates. That is the conclusion, and the data supports it. The Treasury is buying back bonds, the Fed has been cutting its rate, and your mortgage rate is still 6.65% and rising. The 10-year Treasury yield is at 4.65%, up 44 basis points since January. The 30-year is at 5.19%, near a 20-year high. The bond market is bigger than the government, and it is pricing in fiscal risk that no buyback program can erase.
So what should a normal person do? First, stop waiting for rates to go back to 3%. They might, but probably not soon, and nobody knows. The 10-year yield has been above 4% for most of 2025 and 2026, and the 20-year median is 2.82%, meaning the current environment is a reversion to historical norms, not an anomaly. Plan your finances around 6-7% mortgage rates, not 3% rates.
Second, if you have variable-rate debt, pay it down or refinance to fixed. Credit card rates above 21% are not going to drop meaningfully even if the Fed cuts further, because banks are pricing in long-term rate risk. A 0.25% Fed cut does not move your 21% APR. Paying down credit card debt is the highest guaranteed return you can earn right now.
Third, if you are buying a house, do not bet on refinancing in two years. The refinance window may not open. Buy a house you can afford at 6.65%, not one you can only afford at 4%. If rates do fall, you can refinance and pocket the savings. If they do not, you are not trapped.
Fourth, if you have savings, take advantage. High yields on Treasury bills, money market funds, and CDs are one of the few benefits of this environment. A 5% yield on a 6-month Treasury is a real, risk-free return. The government cannot control rates, but you can benefit from the rates the market has set.
Finally, watch the 10-year Treasury yield. It is the single number that tells you what is happening to your money. When it goes up, your mortgage rate goes up, your credit card rate goes up, and the government's interest bill goes up. When it goes down, the pressure eases. Right now, it is at 4.65% and climbing. The government is trying to push it down. The market is pushing it up. The market is winning.
Sources
[1] Federal Reserve Bank of St. Louis (FRED), "10-Year Treasury Constant Maturity Rate (DGS10)", https://fred.stlouisfed.org/graph/fredgraph.csv?id=DGS10
[2] Federal Reserve Bank of St. Louis (FRED), "30-Year Treasury Constant Maturity Rate (DGS30)", https://fred.stlouisfed.org/graph/fredgraph.csv?id=DGS30
[3] Federal Reserve Bank of St. Louis (FRED), "30-Year Fixed Rate Mortgage Average in the United States (MORTGAGE30US)", https://fred.stlouisfed.org/graph/fredgraph.csv?id=MORTGAGE30US
[4] Federal Reserve Bank of St. Louis (FRED), "2-Year Treasury Constant Maturity Rate (DGS2)", https://fred.stlouisfed.org/graph/fredgraph.csv?id=DGS2
[5] Federal Reserve Bank of St. Louis (FRED), "Federal Funds Effective Rate (FEDFUNDS)", https://fred.stlouisfed.org/graph/fredgraph.csv?id=FEDFUNDS
[6] BBC News, "Markets shrug off treasury bond buyback scheme" (August 21, 2026), https://www.bbc.com/news/business
[7] BBC News, "US Treasury boosts bond buyback scheme" (August 21, 2026), https://www.bbc.com/news/business
[8] BBC News, "US national debt passes $40tn after doubling in a decade" (August 2026), https://www.bbc.com/news/business
[9] BBC News, "Global borrowing costs hit fresh highs over oil, AI and inflation concerns" (August 19, 2026), https://www.bbc.com/news/business
[10] US Department of the Treasury, Daily Treasury Par Yield Curve Rates, https://home.treasury.gov/resource-center/data-chart-center/interest-rates/TextView?type=daily_treasury_yield_curve
[11] CNBC, Bonds & Rates page (August 2026), https://www.cnbc.com/bonds/