This is the full research report behind the video: every number, source, and chart the script was written from.
How the $140 trillion bond market actually works, and why the comparison is both wrong and uncomfortably close
Finance Research Team July 23, 2026 Report No. 2026-07
Executive summary
The question sounds like something from a Reddit thread at 2 a.m., but it has real teeth. The global bond market is worth roughly $140 trillion. The US government owes about $36 trillion, and in fiscal year 2024 it spent approximately $880 billion just on interest payments to bondholders, more than it spent on national defense. To service that debt, the Treasury issues new bonds to pay off maturing ones, a process called "rollover." If you squint, that looks like Charles Ponzi's operation: new investors' money pays off old investors, and the whole thing needs a constant inflow of fresh cash to stay upright.
This report argues that the comparison is mostly wrong but not entirely crazy. Bonds are not a pyramid scheme because they are backed by something Ponzi never had: the power to tax, the power to print currency, and a real economy generating real output. A bond is a loan with a legal claim on future government revenue. A Ponzi scheme is a loan with a claim on nothing. The distinction matters because it determines what can go wrong and how.
The uncomfortable part is that sovereign debt can behave Ponzi-like under specific conditions: when interest payments grow faster than the economy, when new issuance is needed just to cover interest on old issuance, and when investors start doubting the issuer's willingness or ability to pay. The US is not there yet, but the trajectory is worth watching. Interest on the debt already exceeds defense spending. The 10-year Treasury yield sits at 4.67% as of July 22, 2026, up from 0.93% at the end of 2020. The Congressional Budget Office projects debt-to-GDP will climb past 100% within a decade. None of this means collapse is imminent. It means the margin for error is thinner than it was.
Key findings
- The US Treasury yield curve has shifted dramatically: the 10-year yield went from 0.93% in December 2020 to 4.67% in July 2026, a fivefold increase that has roughly quintupled the government's borrowing costs on new issuance.
- The Federal Reserve holds approximately $4.5 trillion in US Treasury securities as of July 2026, down from a peak of about $5.8 trillion, meaning the central bank is no longer absorbing new supply the way it did during quantitative easing.
- Foreign holders own roughly $8.5 trillion in Treasuries, with Japan ($1.1 trillion) and China ($859 billion) as the largest foreign creditors as of early 2023, though both have been gradually reducing holdings.
- US interest payments on the national debt reached approximately $880 billion in fiscal year 2024, exceeding the defense budget for the first time in American history.
- The debt ceiling was reinstated at $36.1 trillion in January 2025, and the Treasury has been using "extraordinary measures" to avoid default since breaching that limit.
- Fitch Ratings downgraded the US from AAA to AA+ in August 2023, citing "expected fiscal deterioration" and "repeated debt limit standoffs."
- The historical parallel that best illuminates the "pyramid scheme" question is the Mississippi Bubble of 1720, where French government debt was converted into equity shares in a trading company, creating a circular structure that collapsed when new buyers stopped showing up.
Chapter 1: What this means for your money
If you have a 401(k), a pension, a savings account, or a mortgage, you are already inside the bond market whether you know it or not. Most target-date retirement funds hold 40% to 60% of their assets in bonds. Your bank takes your deposits and buys Treasury securities and mortgage-backed bonds with them. Your insurance company holds bonds to make sure it can pay your claims. The interest rate on your mortgage, your car loan, and your credit card is set by reference to Treasury yields. When the 10-year Treasury yield goes from 0.93% to 4.67% in five years, that is not an abstract number on CNBC. It is the reason your mortgage payment went up, your savings account finally pays something, and the government is spending more of your tax dollars on interest than on the military.
Let's start with the kitchen-table version. A bond is an IOU. When you buy a bond, you are lending money to someone, usually a government or a corporation. In exchange, they promise to pay you interest, called a "coupon," at regular intervals, and to return your original money, called the "principal," at a specific date in the future, called "maturity." That is it. There is no secret. No complex derivative structure. No hidden leverage. You give them money, they give you interest, and eventually they give you your money back.
The "pyramid scheme" question comes from a specific observation about government bonds. The US government does not pay off its debt. It rolls it over. When a 10-year Treasury bond matures, the Treasury does not write a check from its savings account. It issues new bonds to raise the money to pay off the old ones. In fiscal year 2024, the government collected about $4.9 trillion in revenue and spent about $6.5 trillion. The gap, roughly $1.6 trillion, was covered by issuing new bonds. Meanwhile, it paid $880 billion in interest to existing bondholders. Some of that interest was paid from tax revenue, and some was paid from money raised by selling more bonds. If you are the kind of person who sees patterns, this looks like a scheme where new money pays off old money.
Here is why it probably is not, at least not yet. The US government has something Charles Ponzi never had: the Internal Revenue Service. The federal government collected $4.9 trillion in tax revenue in 2024. That is real money, extracted from a real economy of 330 million people producing $28 trillion in goods and services per year. Interest payments of $880 billion represent about 18% of federal revenue. That is high by recent historical standards, up from about 6% in 2020 when interest rates were near zero, but it is not at a level where the system breaks. The government can still pay interest from current revenue without issuing a single new bond, if it chose to cut other spending.
But here is where it gets uncomfortable for the average person. When the government spends $880 billion on interest, that is $880 billion it is not spending on roads, schools, medical research, or tax cuts. It is a transfer payment from taxpayers to bondholders. And bondholders are not evenly distributed. The top 1% of households by wealth hold roughly 35% of all financial assets, including bonds. Foreign investors hold about $8.5 trillion in Treasuries. So a growing share of your tax bill is going to wealthy individuals and foreign governments, not because they produced anything, but because they lent the government money at interest rates the government itself set.
The bond market also sets the price of your mortgage. The 30-year fixed mortgage rate typically runs about 1.5 to 2 percentage points above the 10-year Treasury yield. In December 2020, when the 10-year yielded 0.93%, you could get a 30-year mortgage at around 2.7%. In July 2026, with the 10-year at 4.67%, the same mortgage costs about 6.5% to 7%. On a $400,000 loan, that is the difference between a $1,625 monthly payment and a $2,530 monthly payment. The bond market did that to you, and the bond market did it because the Federal Reserve raised interest rates from 0.25% in 2021 to a peak of 5.5% in 2024, then cut to 3.63% by July 2026.
Your savings account is also a bond market story. When you deposit money in a bank, the bank buys bonds with it. In 2020, when Treasury yields were near zero, banks paid you 0.01% on your savings. In 2026, with the 3-month Treasury yielding 3.89%, banks are paying 3% to 4% on high-yield savings accounts. The bond market giveth, and the bond market taketh away.
The point of this chapter is simple: bonds are not a sideshow. They are the plumbing of the entire financial system. Your retirement, your mortgage, your savings, and your tax bill are all connected to what the Treasury yields and what the Federal Reserve does with interest rates. The question of whether bonds are a "pyramid scheme" is not academic. It is a question about whether the system that determines your mortgage rate and your retirement income is built on solid ground or on a structure that needs constant new money to avoid collapse.
Chapter 2: The Mississippi Bubble, or when government debt actually was a pyramid scheme
The closest historical parallel to the "are bonds a pyramid scheme" question is not Bernie Madoff. It is not even the 2008 financial crisis. It is France in 1719, and a man named John Law.
John Law was a Scottish economist, gambler, and financial engineer who in 1716 convinced the French government, then drowning in debt from the wars of Louis XIV, to let him establish a central bank. France's government debt at the time was enormous relative to its economy, roughly 200% of GDP, and the crown was defaulting on its obligations with depressing regularity. Tax collection was a mess. The nobility was largely exempt. The peasantry was overtaxed and underpaid. The system was, in modern terms, insolvent.
Law's solution was elegant and, in retrospect, insane. He created the Mississippi Company (Compagnie d'Occident), which was granted a monopoly on trade with France's Louisiana territory in North America, then a vast and largely unexplored expanse. The company's shares were offered to the public. But here was the trick: the French government's creditors, the people who held government bonds, were allowed to exchange those bonds for shares in the Mississippi Company. The government debt was converted into equity. The state's obligations to bondholders became the state's obligations to shareholders, and the value of those shares depended entirely on the profitability of a trading company whose actual business was, at that point, mostly theoretical.
This is where the pyramid structure becomes visible. Law needed the share price to keep rising so that creditors would keep exchanging their bonds for shares. To drive the share price up, he printed money, literally, through his central bank, the Banque Royale. The bank issued paper currency that investors used to buy Mississippi Company shares. The share price went from 500 livres in early 1719 to roughly 10,000 livres by December 1719, a twentyfold increase in less than a year. People sold their houses, their furniture, their jewelry to buy shares. The streets of Paris were mobbed with people trying to get a piece of the action.
The structure was circular. The government owed money to bondholders. Bondholders exchanged bonds for shares. Share prices rose because new buyers kept entering the market. New buyers entered the market because the central bank printed money that could be used to buy shares. The central bank could print money because the government backed it. And the government could back it because the Mississippi Company's shares, theoretically, represented the wealth of Louisiana.
There was only one problem. Louisiana was mostly swamp and forest. It had some fur trading and some tobacco, but nothing close to the wealth that the share price implied. The company's actual revenue was a rounding error compared to its market capitalization. When investors started to figure this out, they began converting their shares back into paper currency and then into gold and silver coins. The bank did not have enough coin to honor the redemptions. Law tried to devalue the currency. Panic set in. By late 1720, the share price had collapsed back to near its starting point. Thousands of investors were wiped out. John Law fled France disguised as a woman, according to some accounts, and died in poverty in Venice in 1729.
The Mississippi Bubble is the closest historical example of government debt being structured in a way that genuinely resembled a Ponzi scheme. The system required a constant inflow of new buyers to sustain the share price. When new buyers stopped coming, the structure collapsed. The government's debt was not eliminated by the scheme; it was merely converted into a different form and then destroyed along with the savings of the people who had been persuaded to participate.
What carries over to today? Three things.
First, the mechanism of rolling over government debt is structurally similar to what Law did, even if the scale and the safeguards are different. The US Treasury issues new bonds to pay off maturing ones. If investors stop buying new bonds, the system faces a liquidity problem. The difference is that the US has the IRS, the Federal Reserve, and the world's largest economy behind its bonds. France in 1719 had a bankrupt monarchy and a swamp in Louisiana.
Second, the role of the central bank is critical. Law's Banque Royale printed money to support the share price. The Federal Reserve printed money, through quantitative easing, to buy Treasury securities and mortgage-backed bonds between 2008 and 2022, expanding its balance sheet from under $1 trillion to about $9 trillion at the peak. The Fed has since reduced its holdings to about $6.7 trillion as of July 2026, of which roughly $4.5 trillion is in Treasury securities. The parallel is not exact, but the mechanism, a central bank creating money to absorb government debt, is the same one Law used, with better safeguards and more transparency.
Third, the collapse comes not when the debt is large but when confidence in the issuer's ability to pay breaks. France's debt was large for decades before the bubble. What triggered the collapse was the realization that the underlying asset, Louisiana, was not worth what people thought. For the United States, the underlying asset is the taxing power of the federal government and the productivity of the American economy. As long as those are credible, the bonds are not a Ponzi scheme. If they stop being credible, the comparison becomes uncomfortably apt.
One more thing from the Law episode that resonates: the conversion of debt into something else. Law converted government bonds into equity shares. The modern equivalent is less dramatic but real. The Federal Reserve's quantitative easing converted Treasury bonds into bank reserves, which are functionally deposits at the Fed. The Treasury's interest payments convert future tax revenue into present-day transfers to bondholders. Each conversion preserves the system but changes its shape, and each conversion depends on the continued willingness of someone, somewhere, to hold the paper.
Chapter 3: How bonds actually work, step by step
The bond market is not one thing. It is several markets stacked on top of each other, each with its own rules, its own participants, and its own risks. To understand whether bonds are a pyramid scheme, you need to understand the mechanics. So here is the step-by-step, with as little jargon as possible.
Step 1: The Treasury auction
The US government needs to borrow money. It does this through auctions run by the Treasury Department, typically held every week for short-term bills and every month for longer-term notes and bonds. The Treasury announces how much it wants to borrow and for how long. Primary dealers, about two dozen large financial institutions including JPMorgan, Goldman Sachs, and Citigroup, submit bids. Some bids are "competitive," meaning the dealer specifies the yield they demand. Others are "non-competitive," meaning the dealer accepts whatever yield the auction determines. The Treasury fills the non-competitive bids first, then fills competitive bids from lowest yield to highest until the offering amount is reached. The highest accepted yield becomes the "stop-out rate," and all winning bidders pay that same rate. This is called a "Dutch auction," and it has been the standard since the 1990s.
In fiscal year 2024, the Treasury auctioned roughly $25 trillion in new securities. That sounds like a staggering number, and it is, but most of it was rolling over old debt that matured. The net new issuance, the amount that actually increased the total debt, was closer to $1.6 trillion.
Step 2: The secondary market
Once the Treasury sells a bond at auction, the buyer can hold it to maturity or sell it to someone else. This happens in the secondary market, which is an over-the-counter network of dealers, not a centralized exchange like the New York Stock Exchange. When you hear that "the 10-year yield rose to 4.67%," that is the secondary market at work. Bond prices and yields move in opposite directions. If you buy a 10-year Treasury at par, meaning $1,000 for a $1,000 face value bond, and the coupon is 4.67%, you get $46.70 per year. If market yields then rise to 5.5%, nobody will pay you $1,000 for a bond that only pays $46.70 when they could buy a new one that pays $55. So the price of your bond falls to about $936. You still get your $46.70 per year and your $1,000 at maturity, but if you sell before maturity, you take a loss. This is "interest rate risk," and it is the main reason bond prices fluctuate.
Step 3: The coupon payments
The Treasury pays interest on its bonds every six months. For a 10-year note with a 4.67% coupon, that is $23.35 every six months per $1,000 face value. These payments come from the Treasury's general fund, which is funded by tax revenue and new borrowing. This is where the "pyramid scheme" question gets its bite: if the Treasury is paying interest from new borrowing, it is using new investors' money to pay old investors. We will get to whether that is actually happening in Chapter 6.
Step 4: Maturity and rollover
When a bond matures, the Treasury returns the principal. But the Treasury does not have a savings account with $36 trillion in it. It pays the maturing bondholder by issuing new bonds and using the proceeds. This is "rollover," and it is the single most important mechanic to understand. The US government has not run a budget surplus since fiscal year 2001. Every year since then, it has spent more than it collected, and the difference has been added to the debt. The debt has never been paid down in any meaningful way. It has only been rolled forward.
This is not unusual. The United Kingdom has been continuously in debt since 1694, when the Bank of England was founded specifically to lend money to the government to fight a war against France. The UK has never fully repaid that original debt. It has rolled it forward for 332 years. Japan's government debt-to-GDP ratio is over 250%, the highest in the developed world, and Japan has not defaulted. The mechanism is the same: issue new bonds to pay off old ones, pay interest from tax revenue and new issuance, and maintain investor confidence.
Step 5: The Federal Reserve's role
The Fed is both a participant and a referee. It buys and sells Treasury securities in the open market to control the federal funds rate, the interest rate at which banks lend to each other overnight. When the Fed buys Treasuries, it injects money into the banking system, pushing rates down. When it sells Treasuries or lets them mature without reinvesting, it drains money, pushing rates up. Between 2008 and 2022, the Fed bought roughly $7 trillion in Treasury securities and mortgage-backed bonds through quantitative easing, becoming the single largest holder of US government debt. As of July 2026, the Fed's balance sheet stands at about $6.7 trillion, with about $4.5 trillion in Treasuries, down from a peak of about $5.8 trillion. The Fed is now letting its Treasury holdings run off as they mature, a process called "quantitative tightening," which means the private market has to absorb more of the new issuance.
Step 6: The yield curve
The collection of all Treasury yields across different maturities, from 1 month to 30 years, is called the yield curve. Normally, it slopes upward: longer maturities have higher yields because investors demand more compensation for tying up their money for longer. When the curve inverts, meaning short-term yields exceed long-term yields, it has historically been a reliable predictor of recession. The curve inverted in July 2022 and stayed inverted through most of 2023 and into 2024. As of July 2026, the curve has re-steepened, with the 3-month at 3.89% and the 10-year at 4.67%, suggesting the market expects rates to stay elevated but not to collapse.
The bond market is not a black box. It is a series of auctions, trades, and payments governed by rules that are mostly transparent. The question is not whether the mechanics are sound. They are. The question is whether the economic assumptions underneath those mechanics, that the government will always be able to tax enough, borrow enough, and grow enough to service its debt, remain valid as the debt grows and the interest burden rises.
Chapter 4: The players and the money flows
To understand whether the bond market is structurally sound or structurally Ponzi-like, you need to know who is in it and where the money goes. The US Treasury market is the deepest, most liquid government bond market in the world. Roughly $600 billion in Treasury securities trade hands every day. The players fall into five broad categories, each with different incentives.
Foreign governments and central banks
As of early 2023, foreign holders owned about $7.4 trillion in Treasuries, according to Treasury International Capital data. Japan was the largest at $1.1 trillion, followed by China at $859 billion and the United Kingdom at $668 billion. These holdings are not charity. Foreign central banks buy Treasuries because they need a safe place to park the dollars they accumulate from trade surpluses and currency intervention. When Japan sells cars to the US, it receives dollars. Those dollars need to go somewhere, and Treasuries are the default option. China's holdings have been declining steadily, from a peak of about $1.3 trillion in 2013 to under $900 billion in 2023, a trend that some analysts interpret as a deliberate diversification away from US debt. If foreign demand for Treasuries were to drop sharply, the Treasury would need to find other buyers, which would likely mean offering higher yields, which would mean higher borrowing costs for the government and higher mortgage rates for you.
The Federal Reserve
The Fed holds about $4.5 trillion in Treasury securities as of July 2026, based on the H.4.1 balance sheet release. During the pandemic, the Fed bought Treasuries at a pace of about $80 billion per month, effectively underwriting a large portion of the government's borrowing. Now the Fed is doing the opposite: letting its holdings mature and not reinvesting the proceeds, which shrinks its balance sheet and forces the private market to absorb more supply. Between the peak in 2022 and July 2026, the Fed has shed roughly $300 billion in Treasury holdings. This matters because the Fed is the only buyer that can create money from nothing to buy bonds. When the Fed is buying, the system has a backstop. When the Fed is selling or running off, the system has to stand on its own.
Domestic institutional investors
Pension funds, insurance companies, mutual funds, and bond ETFs hold the largest share of Treasuries. These institutions buy bonds because they need safe, income-generating assets to match their long-term liabilities. A pension fund that owes retirees $10 billion over the next 30 years buys long-duration bonds to lock in predictable cash flows. An insurance company that expects to pay claims buys bonds to earn a return on the premiums it collects. These buyers are relatively price-insensitive: they need bonds regardless of the yield, because the alternative, holding cash, earns nothing and does not match their liabilities. This is one reason the Treasury market is so deep: there is a structural demand for safe assets that does not depend on the yield being attractive.
Primary dealers
The two dozen or so banks and broker-dealers that are designated as primary dealers have an obligation to bid at every Treasury auction. In exchange, they get access to the Fed's discount window and other privileges. They are the market makers, buying from the Treasury at auction and selling to investors in the secondary market. Their profit comes from the spread between the auction price and the secondary market price. In stressed conditions, primary dealers can get stuck holding inventory they cannot sell, which is what happened in March 2020 when the Treasury market briefly seized up and the Fed had to intervene with emergency purchases.
Retail investors
Individual investors can buy Treasuries directly through TreasuryDirect.gov or through brokers and ETFs. This is a small slice of the market, probably under 5% of total holdings, but it has grown as yields have risen. When the 10-year pays 4.67%, retail investors who previously kept money in 0.01% savings accounts have a reason to buy bonds directly.
Now, the money flows. Here is the circular structure that makes people nervous. The Treasury collects tax revenue, about $4.9 trillion in fiscal year 2024. It spends about $6.5 trillion, including $880 billion in interest payments to bondholders. The $1.6 trillion gap is covered by issuing new bonds. Those new bonds are bought by the five categories above. The money from those buyers flows back to the Treasury, which uses it to pay maturing bonds and ongoing expenses, including interest. Some of that interest goes to the Federal Reserve, which then remits it back to the Treasury as profit. In fiscal year 2024, the Fed remitted roughly $100 billion to the Treasury, down from over $100 billion in prior years because the Fed's own interest expenses on bank reserves have risen.
So the money goes in a loop: taxpayers pay taxes to the Treasury, the Treasury pays interest to bondholders, some bondholders are domestic institutions that hold your pension and insurance reserves, and some are foreign governments and wealthy individuals. The system works as long as the loop keeps flowing. It stops working when the inflow of new money, from taxes and new bond purchases, is insufficient to cover the outflow of maturing bonds and interest payments. That is the structural condition that would make the comparison to a Ponzi scheme accurate, and it is the condition we will examine in the data chapters that follow.
One detail worth noting: the Treasury's interest payments are not evenly distributed across the debt. The average maturity of outstanding Treasury debt is about 5.5 years, meaning a large portion of the debt is short-term bills and notes that need to be refinanced frequently. In fiscal year 2024, roughly $25 trillion in Treasuries matured and were rolled over. If yields rise between the old issuance and the new, the government's interest costs increase automatically. This is the rollover risk: the government is not locked into the low rates of 2020 and 2021. As old bonds mature and are refinanced at current rates, the weighted average interest rate on the debt rises. The Congressional Budget Office estimated that the average interest rate on outstanding Treasury debt rose from about 1.8% in 2021 to about 3.3% in 2024, and will continue climbing as old low-yielding bonds are replaced.
Chapter 5: The data: yields, debt, and the interest burden
The argument that bonds are a pyramid scheme rests on a specific claim: that the system needs constant new money to stay upright, and that the inflow is becoming insufficient relative to the outflow. To evaluate that claim, we need to look at the actual numbers. This chapter walks through the data on yields, debt levels, and interest payments, using figures compiled from the US Treasury, the Federal Reserve, and the Treasury International Capital reporting system.
The yield curve shift
The most dramatic change in the bond market over the past six years is the shift in Treasury yields. At the end of December 2020, the 10-year Treasury yielded 0.93%. The 30-year yielded 1.65%. The 3-month bill yielded 0.09%. These were historically low rates, the product of the Federal Reserve cutting the federal funds rate to near zero in March 2020 and buying trillions of dollars in bonds through quantitative easing. The entire yield curve was below 2%.
By July 22, 2026, the picture is entirely different. The 10-year yields 4.67%. The 30-year yields 5.15%. The 3-month bill yields 3.89%. The federal funds rate sits at 3.63%, after the Fed raised it to a peak of 5.5% in 2024 and then cut by roughly 190 basis points through 2025 and 2026. The yield curve has re-steepened to a normal upward-sloping shape, but at a level that is roughly four to five times higher than 2020.
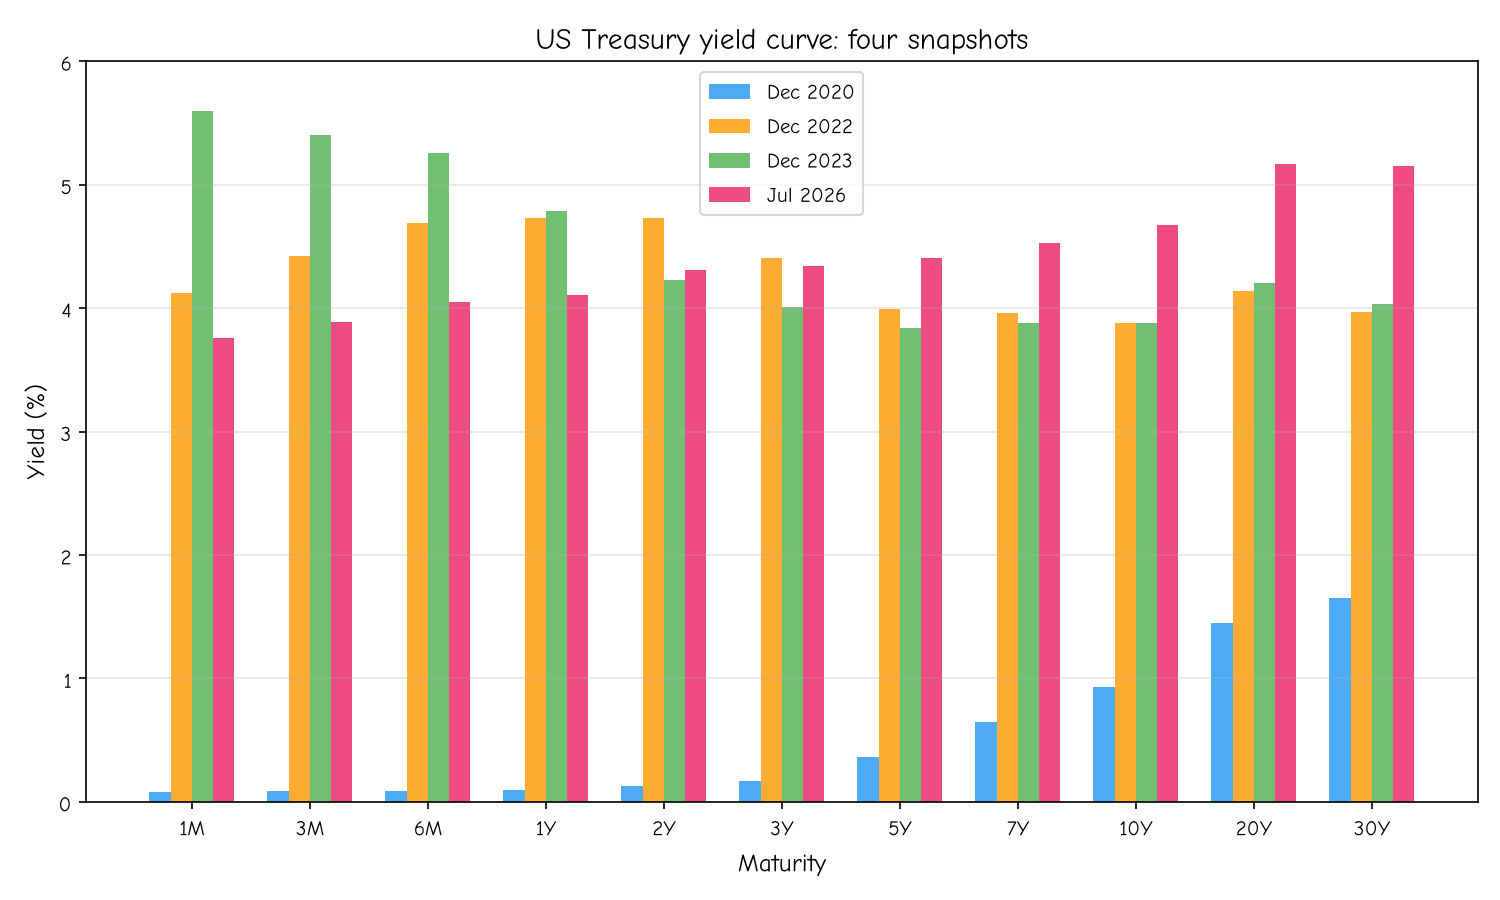
The chart above shows four snapshots of the yield curve: December 2020, December 2022, December 2023, and July 2026. The December 2020 curve is a flat line near the bottom, with every maturity below 2%. The July 2026 curve is substantially higher across all maturities, with the 30-year above 5%. The shift means that every new bond the Treasury issues carries a much higher interest cost than the bonds it issued in 2020 and 2021.
The 10-year yield trajectory
The 10-year Treasury yield is the single most important number in global finance. It sets the benchmark for mortgage rates, corporate bond yields, and the discount rate used to value stocks. Its trajectory over the past six years tells the story of the bond market's transformation.
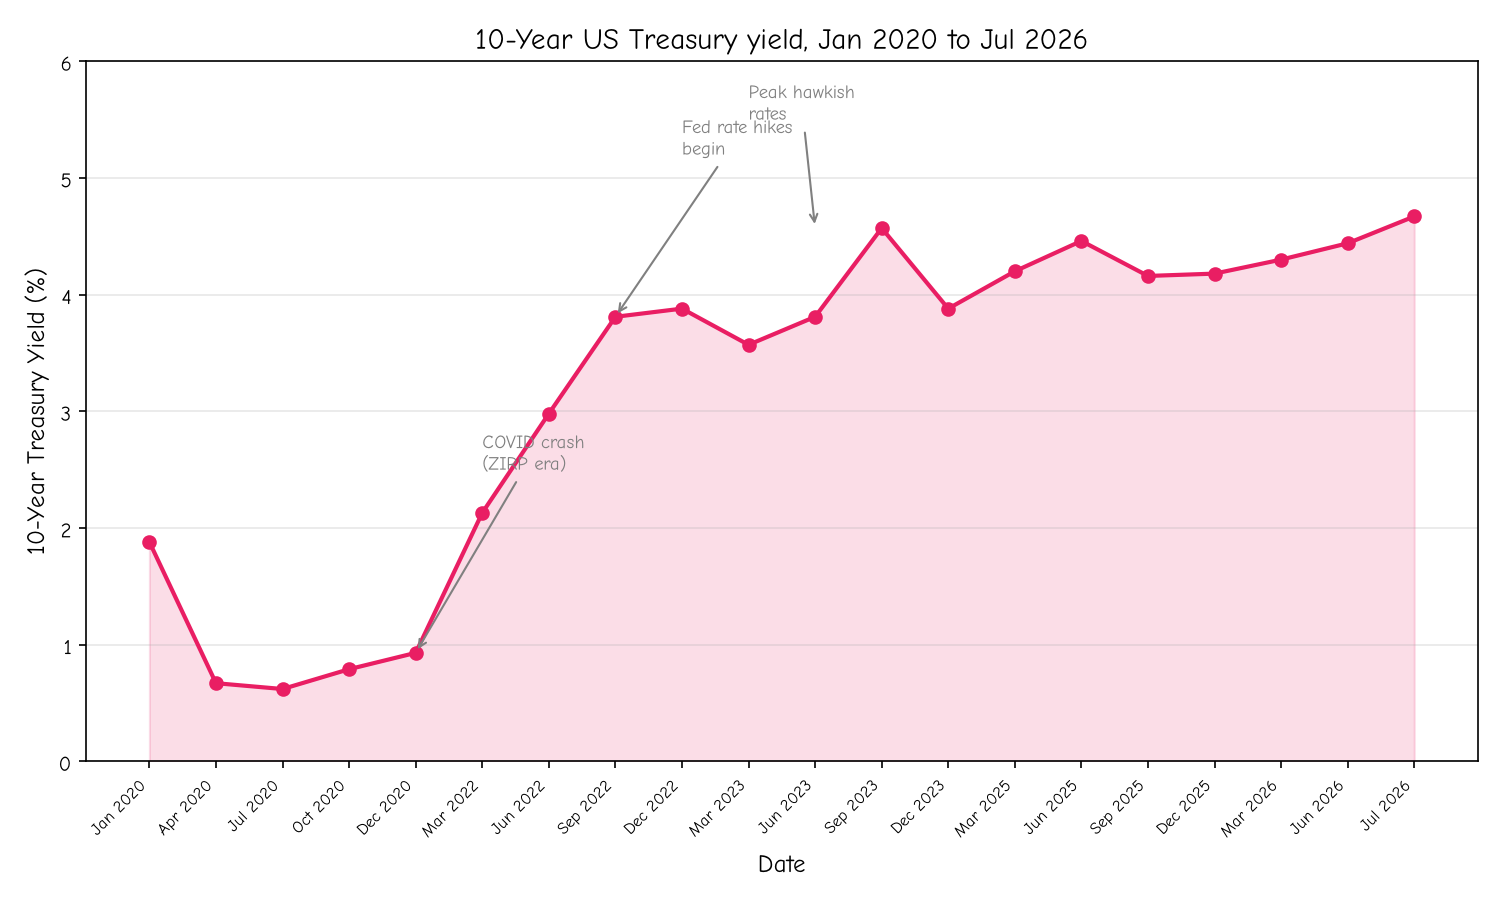
The yield sat below 1% for most of 2020, spiked to 1.5% in early 2021 as inflation expectations rose, then climbed steadily through 2022 as the Fed began raising rates. It peaked above 5% in October 2023, the highest level since 2007. It then declined through 2024 and 2025 as the Fed cut rates, before rising again in 2026 to 4.67%. The yield is still well above its 2020 lows, and the market is pricing in a "higher for longer" environment.
Who owns the debt
The $36 trillion national debt is not owed to a single creditor. It is spread across several categories of holders, each with different motivations and different sensitivity to risk.
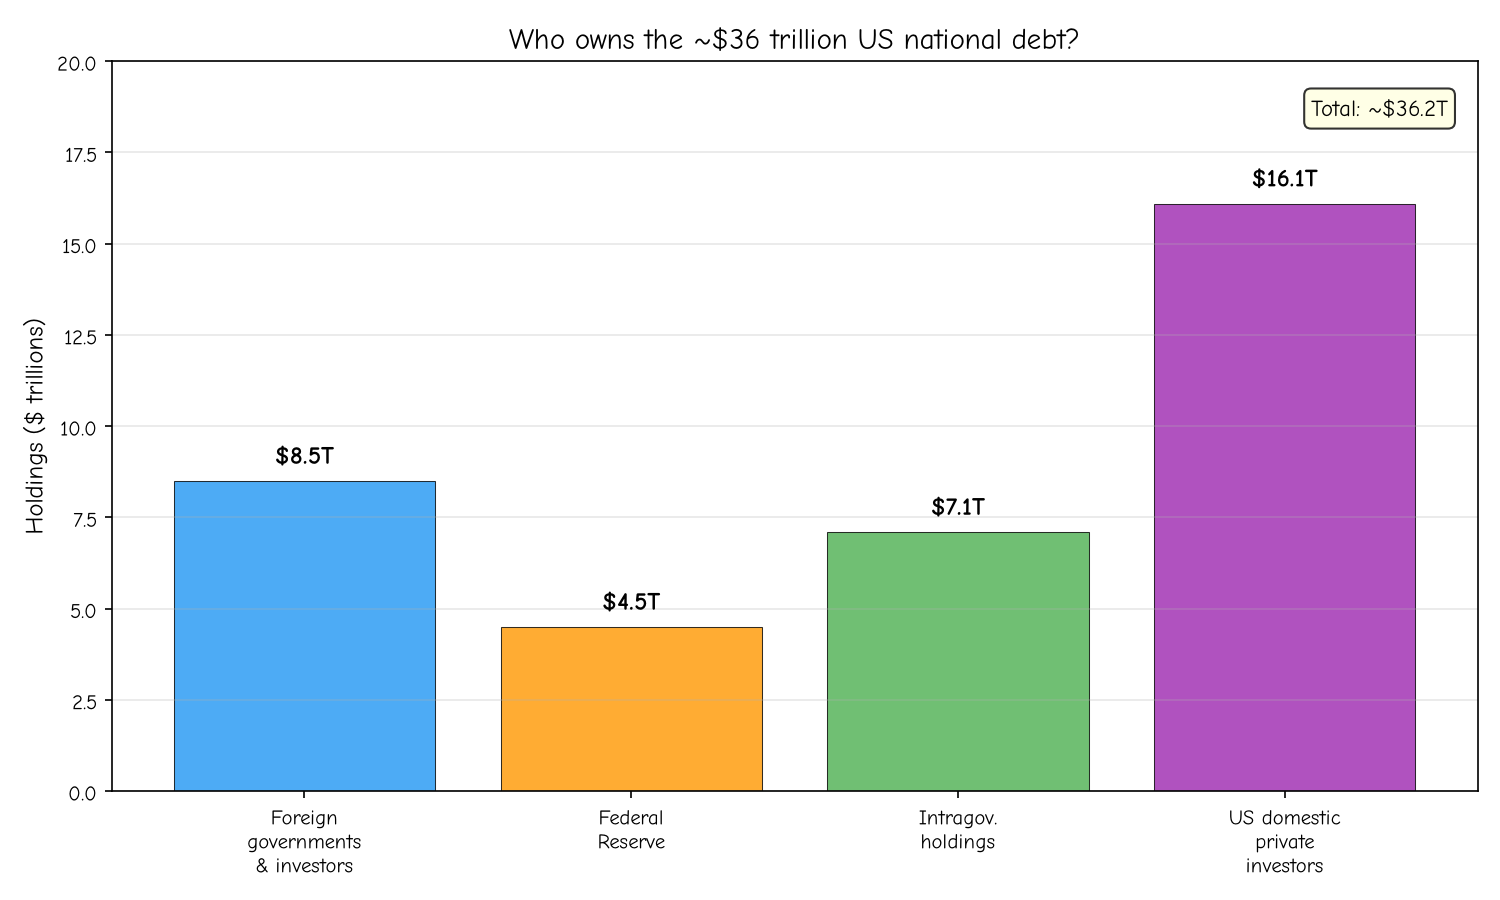
Foreign governments and investors hold roughly $8.5 trillion, about 24% of the total. The Federal Reserve holds about $4.5 trillion, or 12.5%, down from a peak of about 16% in 2022. Intragovernmental holdings, debt the Treasury owes to other federal agencies like the Social Security trust fund, account for about $7.1 trillion, or 20%. The remaining $16.1 trillion, about 44%, is held by domestic private investors: pension funds, insurance companies, mutual funds, banks, and individuals.
This breakdown matters for the pyramid scheme question. In a Ponzi scheme, all the money comes from new investors, and there is no underlying asset. In the Treasury market, about 20% of the debt is held by the government itself, through intragovernmental accounts. Another 12.5% is held by the Federal Reserve, which is technically part of the government. So roughly one-third of the national debt is money the government owes to itself. The portion that matters for sustainability is the roughly $23 trillion held by the public, including foreign investors and domestic institutions.
The interest burden
The most alarming data point in this entire discussion is the growth of interest payments on the national debt. In fiscal year 2020, when Treasury yields were near zero, the government paid about $345 billion in net interest. In fiscal year 2024, that figure reached approximately $880 billion, a 155% increase in four years. For the first time in American history, interest payments on the debt exceeded the defense budget, which was about $850 billion.
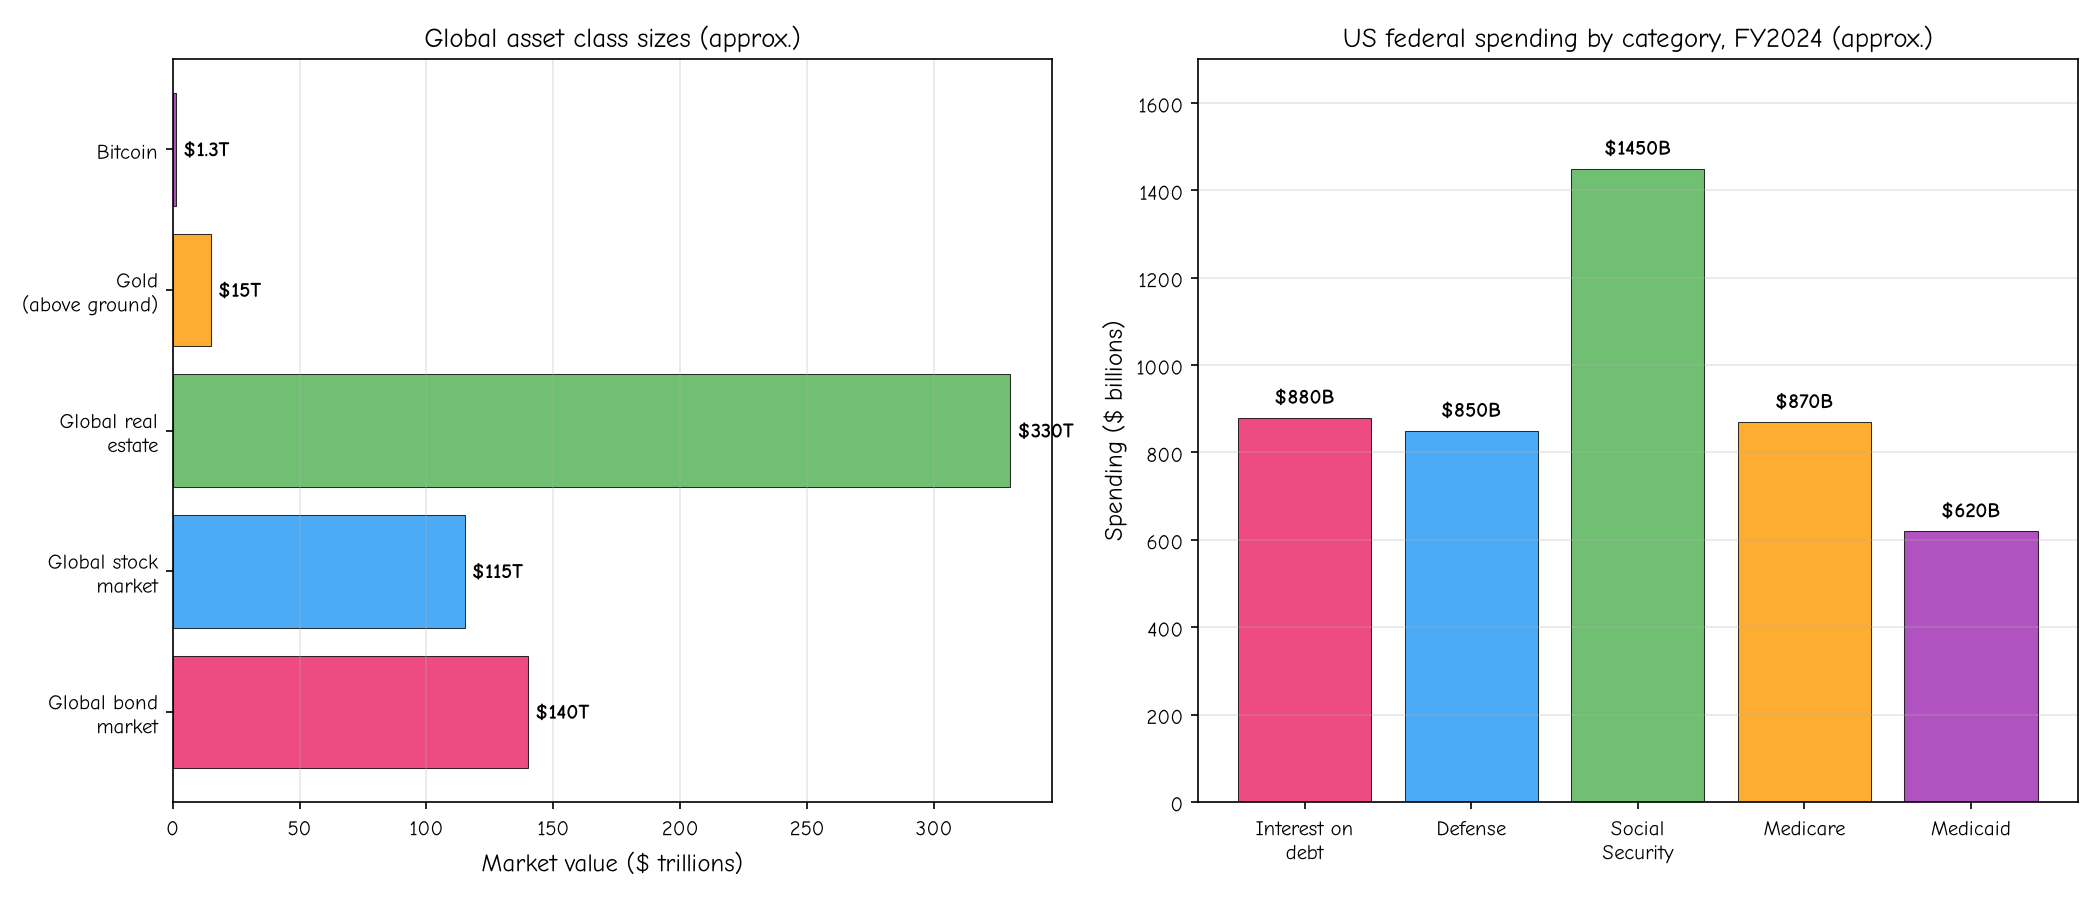
The chart on the right shows US federal spending by category for fiscal year 2024. Interest on the debt, at $880 billion, is now the second-largest line item in the federal budget, behind only Social Security ($1.45 trillion) and roughly tied with Medicare ($870 billion). Defense spending, at $850 billion, has been overtaken. This is not a projection. It has already happened.
The chart on the left shows the global bond market in context. At approximately $140 trillion in outstanding value, the global bond market is larger than the global stock market ($115 trillion) and dwarfs gold ($15 trillion) and Bitcoin ($1.3 trillion). The US Treasury market, at $36 trillion, is the single largest component. When people ask whether bonds are a pyramid scheme, they are asking about a market that is bigger than every stock exchange on earth combined.
The rollover math
Here is where the numbers get uncomfortable. The average interest rate on outstanding Treasury debt was about 1.8% in 2021, according to CBO estimates. By 2024, it had risen to about 3.3%. As old bonds mature and are refinanced at current rates, that average will keep climbing. If the average rate reaches 4.5%, which is plausible given current yields, the annual interest cost on $36 trillion in debt would be about $1.6 trillion. That would exceed the entire defense budget by nearly 90% and would consume about 33% of federal revenue.
The Treasury's own data shows the scale of the rollover challenge. In fiscal year 2024, approximately $25 trillion in Treasury securities matured. Most of these were short-term bills, which the Treasury rolled over by issuing new bills. But the interest rate on those new bills was 4% to 5%, compared to near zero in 2020 and 2021. The government is not paying 2020 rates on its debt. It is paying 2026 rates, and those rates are roughly five times higher.
This is the mechanism that makes the Ponzi comparison stick, even if only partially. The system does not need new investors to pay off old investors in the way a Ponzi scheme does. But it does need new investors to refinance maturing debt at rates that are now much higher, and it needs tax revenue to cover an interest bill that is growing faster than the economy. If GDP grows at 2.5% per year and interest costs grow at 10% per year, the ratio of interest to GDP rises every year. That is not a Ponzi scheme. It is an unsustainable fiscal trajectory, which is a different and more boring problem, but one that can end the same way if left unaddressed.
Chapter 6: Is it a Ponzi scheme? The structural comparison
Now we get to the actual question. Let's lay out the comparison side by side, using the SEC's own definition of a Ponzi scheme and the structural features of the Treasury market.
A Ponzi scheme, as defined by the Securities and Exchange Commission, is "an investment fraud that pays existing investors with funds collected from new investors." The scheme "collapses when it becomes difficult to recruit new investors or when a large number of investors ask to cash out." The key features are: returns are paid from new capital, not from profits; there is no underlying business generating real returns; the operator lies about where the money comes from; and the system requires constant growth in new money to survive.
Government bonds share some structural features with this definition, but not all of them. Here is the comparison, point by point.
Are returns paid from new capital? Partially. The Treasury pays interest from a combination of tax revenue and new borrowing. In fiscal year 2024, the government collected $4.9 trillion in taxes and paid $880 billion in interest. About 18% of revenue went to interest. The rest covered defense, Social Security, Medicare, and other programs. So most interest payments come from existing revenue, not from new bond issuance. But the $1.6 trillion budget deficit means that a portion of all spending, including interest, is funded by new debt. If the government were running a surplus, no new borrowing would be needed and the Ponzi comparison would be moot. It is not running a surplus, and has not since 2001.
Is there an underlying business generating real returns? Yes. The "business" is the US economy, which produces about $28 trillion in GDP per year. The government extracts about 17% of that as tax revenue. The bond is a claim on a fraction of future economic output, mediated through the tax system. This is the fundamental difference between a Treasury bond and a Ponzi investment. A Ponzi scheme has no underlying cash flow. A Treasury bond has a claim on the output of 330 million people and the taxing authority of the federal government. The cash flow is real, large, and legally enforceable.
Does the operator lie about where the money comes from? No. The Treasury publishes its borrowing plans, auction results, and interest payments in real time. The Federal Reserve publishes its balance sheet weekly. The CBO publishes long-term budget projections. Anyone with an internet connection can see exactly how much debt the government has, who holds it, what it pays in interest, and what it expects to owe in the future. Transparency is the opposite of what a Ponzi operator does. Charles Ponzi told investors he was making money on postal reply coupons. He was not. The Treasury tells investors it will pay them interest from tax revenue and new borrowing. It does.
Does the system require constant growth in new money to survive? Yes, but with a critical caveat. The Treasury needs to issue new bonds to roll over maturing debt and fund deficits. If investors stopped buying Treasuries entirely, the government would face a liquidity crisis. But the system does not require exponential growth in new money the way a Ponzi scheme does. A Ponzi scheme promises a fixed rate of return to an ever-growing base of investors, so the required inflow grows exponentially. The Treasury's interest obligation grows linearly with the debt and the interest rate, and the debt grows with the deficit. If the deficit were zero, the debt would stabilize and the rollover would be a simple refinancing operation, not a growing obligation. The problem is that the deficit is not zero, and the interest rate is not zero, so the debt and the interest bill both grow.
What about the power to create money? This is the feature that makes sovereign debt categorically different from a Ponzi scheme and from private debt. The US government, through the Federal Reserve, can create US dollars. It cannot run out of money in the way a household or a business can. If the Treasury needs to pay interest and cannot raise enough from taxes or new bond sales, the Fed can, in extremis, create the money. This is what "monetizing the debt" means, and it is what the Fed did during quantitative easing. The cost of doing this is inflation. If the Fed prints money to buy government bonds, the money supply expands, and if the economy is at full capacity, prices rise. Inflation is the tax that a sovereign currency issuer pays when it monetizes its debt. It is not default, and it is not a Ponzi collapse, but it is a real cost borne by everyone who holds dollars.
What about the power to tax? The IRS collected $4.9 trillion in 2024. If the government needed to raise more, it could, up to the political and economic limits of taxation. The Laffer curve argument, that tax rates can be so high that they reduce revenue, is real but probably not binding at current US tax levels, which are low by international standards. The US federal tax take is about 17% of GDP, compared to about 34% for the average OECD country. There is substantial room to raise taxes before hitting the point of diminishing returns. Whether there is political will to do so is a different question.
So the verdict: government bonds are not a Ponzi scheme. They are a sovereign debt instrument backed by taxing power, money creation, and a real economy. The comparison fails on the most important dimensions: there is a real underlying cash flow, the operator is transparent, and the system has tools, taxation and money creation, that a Ponzi operator does not.
But the comparison is not entirely wrong, either. The system does require constant new issuance to roll over maturing debt. It does pay interest partly from new borrowing. And if the debt and interest burden grow faster than the economy for long enough, the system reaches a point where investors demand higher yields to compensate for the risk, which raises the interest burden further, in a feedback loop that economists call a "doom loop." This is what happened to Greece in 2010, when interest payments on government debt exceeded the government's ability to borrow or tax, and the European Central Bank had to intervene to prevent collapse. Greece could not print its own currency, so it could not monetize its debt. The US can, which is why the Greek scenario is unlikely but not impossible if political dysfunction prevents the government from raising revenue or controlling spending.
The honest answer is that bonds are not a pyramid scheme, but they can become one if the government's fiscal trajectory deteriorates far enough. The line between "sovereign debt with a rising interest burden" and "a scheme that needs new money to survive" is not a bright line. It is a spectrum, and the US has been moving along that spectrum in the wrong direction for the past five years.
Chapter 7: What could go wrong, and what probably won't
The bond market has survived wars, depressions, financial crises, and political dysfunction for over two centuries. The US Treasury has never defaulted on its debt. That track record is not a guarantee of future performance, as every prospectus says, but it is a data point worth taking seriously. This chapter looks at the scenarios that could break the system, the ones that probably will not, and the signals to watch.
Scenario 1: The doom loop
This is the scenario that most resembles a Ponzi collapse. It works as follows. The debt grows faster than GDP. Interest payments consume a rising share of tax revenue. Investors perceive the trajectory as unsustainable and demand higher yields to hold Treasuries. Higher yields raise the interest burden further. The government borrows more to cover the higher interest, which increases the debt, which makes investors more nervous, which raises yields again. The loop accelerates until either the central bank intervenes by printing money, causing inflation, or the government defaults.
Has this happened before? Yes, to countries that do not issue their own currency. Greece in 2010, Argentina repeatedly, and Weimar Germany in 1923 are all examples of sovereign debt spirals. But it has never happened to a country that issues its own reserve currency and has a central bank that can buy its debt. Japan has a debt-to-GDP ratio above 250% and has not experienced a doom loop, because the Bank of Japan owns roughly half of all Japanese government bonds and can control yields through "yield curve control."
For the US, the doom loop is unlikely but not impossible. The CBO projects debt-to-GDP will exceed 100% within a decade, up from about 97% in 2024. Interest payments are projected to reach $1.7 trillion by 2034, or about 4% of GDP. These projections assume that interest rates gradually decline from current levels. If rates stay at 4.5% or higher, the projections worsen significantly. The doom loop would begin if investors started demanding a "fiscal risk premium," an extra yield to compensate for the possibility that the government might inflate away the debt or restructure it. There is no evidence of this premium yet. The 10-year yield at 4.67% is consistent with normal economic conditions, not with a fiscal crisis. But the premium can appear quickly, as it did in Italy in 2011 and Greece in 2010.
Scenario 2: Inflation as the hidden default
If the government cannot or will not raise taxes or cut spending enough to stabilize the debt, the alternative is to let inflation do the work. Inflation reduces the real value of debt because bonds are denominated in nominal dollars. If you hold a 30-year Treasury bond paying 3% and inflation runs at 5% per year, the real value of your bond declines by about 2% per year. Over 30 years, the real value of your principal falls by roughly 45%. You get your $1,000 back, but it buys half as much.
This is not a conspiracy theory. It is a well-understood mechanism. The Federal Reserve's inflation target is 2%, which means the central bank is deliberately eroding the real value of bondholders' claims by 2% per year. At 2% inflation, a 10-year bond with a 4.67% yield provides a real yield of about 2.67%, which is a fair return. But if inflation were to rise to 5% or 6% and stay there, bondholders would lose real value, and the government's real debt burden would shrink. This is "financial repression," and it was the primary mechanism by which the US reduced its post-World War II debt from 119% of GDP in 1946 to about 30% by the 1970s. The government did not pay off the debt. It grew the economy faster than the debt grew, and let inflation erode the real value of the bonds.
The risk here is not that inflation will destroy the bond market. The risk is that bondholders will figure it out and demand higher yields to compensate, which brings us back to the doom loop. The 10-year Treasury Inflation-Protected Security (TIPS) yield, which measures the real return bondholders demand, is 2.37% as of July 22, 2026. That is a historically normal real yield. If it were to spike to 3.5% or 4%, it would signal that investors are demanding much more compensation for inflation and fiscal risk, which would be a warning sign.
Scenario 3: Foreign buyer strike
If foreign central banks and investors stop buying Treasuries, the Treasury would need to find domestic buyers to absorb the supply. This is not catastrophic, but it would likely mean higher yields. Foreign holdings have already declined from about 50% of publicly held debt in 2008 to about 30% in 2024. The slack has been picked up by domestic investors, including money market funds, pension funds, and the Fed. A complete foreign buyer strike is unlikely because there is no good alternative to Treasuries for parking large amounts of dollars. The German bund market is too small. Japanese government bonds yield less than 1%. Gold is too cumbersome. But a gradual reduction in foreign demand, combined with the Fed's balance sheet reduction, means the private market has to absorb more supply, which puts upward pressure on yields.
Scenario 4: Political dysfunction and the debt ceiling
The debt ceiling is a self-imposed constraint that Congress created in 1917 and has raised or suspended roughly 100 times since. It is not an economic limit; it is a political one. The US hit the current ceiling of $36.1 trillion in January 2025 and has been using "extraordinary measures" since then. Each time the ceiling is approached, the market gets nervous. In 2011, the standoff led to S&P downgrading the US credit rating from AAA to AA+, and stock prices fell sharply. In 2023, another standoff led to Fitch downgrading the US from AAA to AA+ in August, citing "expected fiscal deterioration over the next three years" and "repeated debt limit standoffs and last-minute resolutions."
A genuine default, even a technical one where the Treasury misses a payment by a day, would be catastrophic. Treasury securities are used as collateral in trillions of dollars of financial transactions. They are considered "risk-free" for regulatory purposes. If they were suddenly not risk-free, the entire financial system's plumbing would need to be repriced. The 2011 and 2023 episodes showed that even coming close to default has real costs: higher borrowing costs, lower consumer confidence, and damaged credibility. The debt ceiling is not a pyramid scheme, but it is a self-inflicted vulnerability that makes the system more fragile than it needs to be.
What probably will not happen
A sudden, Madoff-style collapse of the Treasury market is not a realistic scenario. The market is too deep, the government's tools are too powerful, and the global financial system is too dependent on Treasuries for that to happen without warning. The more likely path, if the fiscal trajectory is not corrected, is a slow erosion: gradually rising yields, gradually rising inflation, gradually declining real returns for bondholders, and a gradually increasing share of the federal budget consumed by interest payments. This is the "boiling frog" scenario, and it is the one that most fiscal economists worry about. It is not dramatic, but it is corrosive, and it transfers wealth from taxpayers and savers to bondholders and debtors over a period of decades.
The signal to watch is the real yield on long-term Treasuries. If the 10-year TIPS yield rises above 3% and stays there, it means investors are demanding a large premium for holding government debt, which would be the first sign that the market is pricing in fiscal risk. As of July 2026, the 10-year TIPS yield is 2.37%, which is elevated by historical standards but not alarming. The other signal is the ratio of interest payments to federal revenue. At 18% in 2024, it is high but manageable. If it exceeds 25%, the system enters the zone where most economists consider the debt trajectory unsustainable without significant policy changes.
Conclusion: What a normal person should take away
If you have read this far, you know more about how the bond market works than most people who appear on financial television. Here is what to do with that knowledge.
First, the direct answer to the question. No, bonds are not a pyramid scheme. A pyramid scheme has no underlying cash flow, relies on deception, and collapses when new money stops coming in. Government bonds are backed by the taxing power of a sovereign state, the productivity of a $28 trillion economy, and the ability of a central bank to create currency. The system is transparent, the cash flows are real, and the tools available to prevent collapse, taxation, money creation, and fiscal adjustment, are genuine. If you are holding Treasury bonds in your retirement account, you are not participating in a Ponzi scheme. You are lending money to the most creditworthy borrower in human history, a borrower that has never missed a payment in 240 years.
Second, the uncomfortable caveat. The system is not infinite. It depends on the government's ability to service its debt, which depends on the economy growing fast enough and tax revenue being sufficient to cover interest payments. Right now, interest consumes about 18% of federal revenue. That is manageable but trending in the wrong direction. If it reaches 25% or 30%, the margin for error shrinks, and the comparison to a Ponzi scheme, while still technically wrong, becomes less comforting. The US is not Greece, because it can print its own money. But printing money has a cost, and that cost is inflation, which is a tax on everyone who holds dollars.
Third, what this means for your money. If you own bonds, you should understand that you are taking two risks: interest rate risk, the risk that rates rise and your bond loses market value, and inflation risk, the risk that inflation erodes the purchasing power of your interest payments and principal. Treasury Inflation-Protected Securities (TIPS) address the second risk. Short-duration bonds address the first. A diversified portfolio that includes both nominal and inflation-protected bonds, across different maturities, is the rational approach for most investors.
Fourth, what to watch. Three numbers tell you whether the system is healthy or heading toward trouble. The 10-year Treasury yield, currently 4.67%, tells you the government's borrowing cost. The 10-year TIPS yield, currently 2.37%, tells you the real return investors demand after inflation. If the TIPS yield rises above 3%, the market is pricing in fiscal risk. The ratio of interest payments to federal revenue, currently about 18%, tells you how much of your tax bill is going to bondholders. If it exceeds 25%, the fiscal trajectory is unsustainable without policy changes.
Fifth, the big picture. The bond market is not a sideshow or a scam. It is the foundation of the global financial system. Your mortgage rate, your savings rate, your pension's solvency, and your government's ability to function all depend on it. The fact that it is not a pyramid scheme does not mean it is risk-free. It means the risks are different: not the risk of a sudden collapse, but the risk of a slow erosion of value through inflation and rising interest costs. The best thing you can do is understand the system, diversify your exposure, and pay attention to the signals. The bond market will not disappear overnight. But it can quietly transfer your wealth to someone else over a period of years, and that is a risk worth taking seriously.
The Mississippi Bubble collapsed because the underlying asset was a swamp. The US bond market rests on a more solid foundation: the productivity of the American economy and the taxing power of the federal government. But foundations can crack, and the crack usually starts with a number that everyone can see but nobody wants to acknowledge. Right now, that number is $880 billion in annual interest payments, growing every year. It is not a crisis. It is a bill. And bills have a way of coming due.
Sources
- US Treasury Fiscal Data, Monthly Statement of the Public Debt (MSPD) dataset, https://fiscaldata.treasury.gov/datasets/monthly-statement-of-public-debt/
- Federal Reserve Board, H.15 Selected Interest Rates (Daily), release dated July 22, 2026, https://www.federalreserve.gov/releases/h15/
- US Treasury, Daily Treasury Par Yield Curve Rates, 2026 data (CSV), https://home.treasury.gov/resource-center/data-chart-center/interest-rates/daily-treasury-rates.csv/2026/all?type=daily_treasury_yield_curve&field_tdr_date_value=2026&page&_format=csv
- US Treasury, Daily Treasury Par Yield Curve Rates, 2025 data (CSV), https://home.treasury.gov/resource-center/data-chart-center/interest-rates/daily-treasury-rates.csv/2025/all?type=daily_treasury_yield_curve&field_tdr_date_value=2025&page&_format=csv
- US Treasury, Daily Treasury Par Yield Curve Rates, 2023 data (CSV), https://home.treasury.gov/resource-center/data-chart-center/interest-rates/daily-treasury-rates.csv/2023/all?type=daily_treasury_yield_curve&field_tdr_date_value=2023&page&_format=csv
- US Treasury, Daily Treasury Par Yield Curve Rates, 2022 data (CSV), https://home.treasury.gov/resource-center/data-chart-center/interest-rates/daily-treasury-rates.csv/2022/all?type=daily_treasury_yield_curve&field_tdr_date_value=2022&page&_format=csv
- US Treasury, Daily Treasury Par Yield Curve Rates, 2020 data (CSV), https://home.treasury.gov/resource-center/data-chart-center/interest-rates/daily-treasury-rates.csv/2020/all?type=daily_treasury_yield_curve&field_tdr_date_value=2020&page&_format=csv
- US Treasury, Interest Rate Statistics page, https://home.treasury.gov/resource-center/data-chart-center/interest-rates/Pages/TextView.aspx?data=yieldYear&year=2026
- Federal Reserve Board, H.4.1 Factors Affecting Reserve Balances, release dated July 16, 2026, https://www.federalreserve.gov/releases/h41/current/
- Federal Reserve Board, Recent Balance Sheet Trends, https://www.federalreserve.gov/monetarypolicy/bst_recenttrends.htm
- US Treasury International Capital (TIC) System, Major Foreign Holders of Treasury Securities, https://ticdata.treasury.gov/Publish/mfh.txt
- Wikipedia, "Ponzi scheme," https://en.wikipedia.org/wiki/Ponzi_scheme
- Investopedia, "Key Basics of Bonds: Understanding the Essentials," https://www.investopedia.com/articles/bonds/08/bond-market-basics.asp
- Investopedia, "What Is a Government Bond?" https://www.investopedia.com/terms/g/government-bond.asp
- Investopedia, "Fiat Money Explained: Benefits, Risks, and Global Examples," https://www.investopedia.com/terms/f/fiatmoney.asp
- Investopedia, "Understanding Sovereign Debt: How Governments Borrow and Its Implications," https://www.investopedia.com/terms/s/sovereign-debt.asp
- Investopedia, "U.S. Debt Ceiling: Definition, History, Pros, Cons, and Clashes," https://www.investopedia.com/terms/d/debt-ceiling.asp
- Investopedia, "Key Factors of the 2008 Financial Crisis Explained" (includes discussion of quantitative easing and central bank bond purchases), https://www.investopedia.com/terms/s/southseabubble.asp