A Python data science service pulls in PyTorch, scikit-learn, pandas, and a Jupyter runtime. The Dockerfile installs them all in one stage, adds curl because someone needed it for a debug script three months ago, and builds on top of python:3.13 with the full Debian layer. The resulting image is 2.54 GB. Every deploy pushes and pulls every byte of it.
This is the most common infrastructure problem that never makes it onto the sprint board. You can reduce Docker image size by an order of magnitude without rewriting your application, and the fix comes down to two moves: pick a smaller base, and stop shipping your build toolchain to production.
Where 2.54 GB of image weight comes from
A deep dive using the dive tool on a real 2.54 GB image found that a single pip install layer added 1.51 GB. The base image contributed another 560 MB, and an apt-get install curl tacked on 19.4 MB. These three layers account for over 80 percent of the total, and none of them need to exist in the runtime artifact. The InfoQ analysis walks through the full layer history and makes the point starkly: your application code is a rounding error next to the dependencies and toolchain you shipped with it.
That bloat costs you in three places: registry storage, pull bandwidth, and cold-start latency. Amazon ECR charges $0.10 per GB per month for storage, which means a 1 GB image with 10 tags costs $1 per month in isolation. Multiply by 20 services and you are looking at $200 per month before data transfer even enters the picture, according to a detailed cost breakdown of production image economics.
Pull bandwidth is the more painful cost for teams that deploy frequently. The same analysis found that ECS tasks in private subnets pull from ECR through a NAT Gateway at $0.01 per GB for inter-AZ transfer. With 20 deploys per day at three tasks per service, a 1 GB image costs about $6 per month in transfer for a single service. A 200 MB image doing the same work costs $1.20.
Cold-start latency is the cost users feel. When ECS or Kubernetes launches a new task on a fresh instance, it has to pull the image before the container starts. A 1 GB image on a standard 1 Gbps link takes 60 to 90 seconds. A 200 MB image takes 8 to 12 seconds. That is the difference between a scaling event that serves traffic before the health check timeout and one that does not.
Multi-stage builds strip build dependencies
Multi-stage builds are the single highest-leverage change for most services. The idea: use one stage to compile and install everything, then copy only the artifact into a clean runtime stage. The build toolchain never touches the final image.
Nick Janetakis demonstrated this with a Flask project that dropped from 523 MB to 273 MB, roughly a 50 percent reduction. The biggest win came from avoiding build-essential, which alone weighs about 250 MB. The same pattern applies to Django, Node, Go, and any stack where the build toolchain is heavier than the runtime artifact.
A Python data processing service documented in the same cost breakdown went from 950 MB to 265 MB with the same pattern. The author noted that untangling tightly coupled build steps in an existing Dockerfile takes more thought than a greenfield one, but once the first conversion is done the pattern becomes muscle memory. Every new service on that platform started multi-stage from day one.
The most dramatic result comes from DigitalOcean's distroless tutorial. A Go application built on a full golang base image came in at 919 MB. The same code, compiled with CGO_ENABLED=0 and copied onto gcr.io/distroless/static-debian12, measured 9.54 MB. That is a 96x reduction, and the push completes in seconds instead of minutes.
Here is the pattern for a typical Python service:
# Build stage
FROM python:3.13-slim-bookworm AS builder
WORKDIR /app
COPY requirements.txt .
RUN pip install --no-cache-dir --prefix=/install -r requirements.txt
# Runtime stage
FROM python:3.13-slim-bookworm
COPY /install /usr/local
WORKDIR /app
COPY . .
CMD ["python", "main.py"]The builder stage installs dependencies into a clean prefix. The runtime stage copies only those installed packages and the application code. No compilers, no cached wheels, no build-essential, no curl you forgot to remove.
For a Node.js TypeScript API, the structure is the same. The builder stage carries node_modules with dev dependencies, TypeScript, and the compiler. The runtime stage gets only the production node_modules and the compiled JavaScript output. This pattern typically drops a Node API from about 800 MB to about 180 MB.
For Go, the pattern is even cleaner because the compiler produces a static binary. Set CGO_ENABLED=0, compile in the builder stage, and copy the single binary onto a distroless static base. You get a production image under 10 MB with zero shared libraries.
Base images and their trade-offs
Your base image choice has more impact on final size than anything else in the Dockerfile. The spectrum runs from full Debian images over 1 GB down to distroless images under 3 MB, and the tradeoff is always size versus compatibility.
| Base image | Approx size | C library | CVE count | Use case |
|---|---|---|---|---|
node:24 |
~1,100 MB | glibc | High | Development only |
node:24-slim |
~230 MB | glibc | Moderate | Safe production default |
gcr.io/distroless/nodejs20-debian12 |
~170 MB | glibc | 0 to 5 | Hardened, no shell |
node:24-alpine |
~55 MB | musl | 5 to 10 | Risky with native modules |
python:3.13-slim-bookworm |
~130 MB | glibc | Moderate | Safe for Python services |
python:3.13-alpine |
~50 MB | musl | 5 to 10 | Risky with NumPy, PyTorch |
alpine:3.20 |
~7 MB | musl | 5 to 10 | Needs full rebuild |
gcr.io/distroless/static-debian12 |
~2 MB | none | 0 to 2 | Static binaries only |
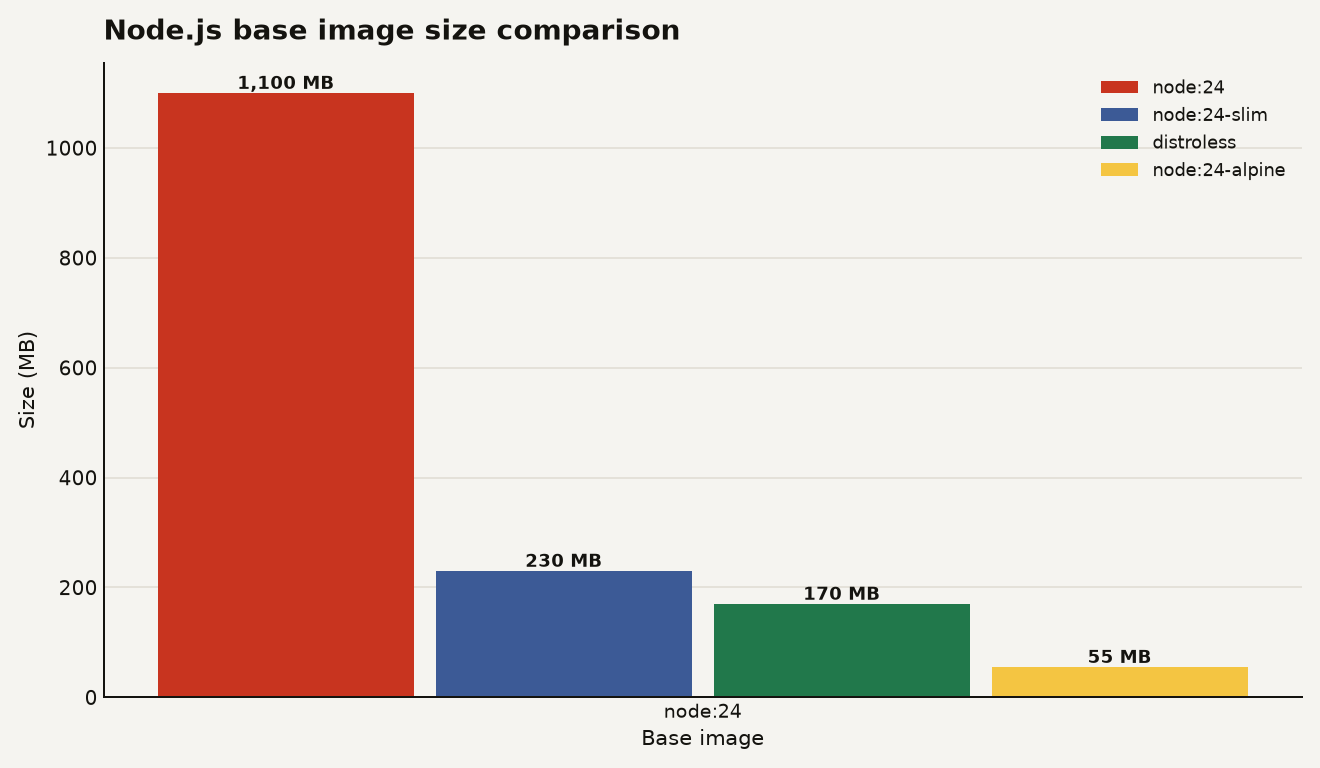
The chart above shows the size spectrum for Node.js base images, from the full node:24 at about 1,100 MB down to node:24-alpine at about 55 MB. The slim variant at 230 MB is the sweet spot for most teams. All four sizes come from the same base image comparison referenced earlier.
The -slim variants of official images are almost always the right call for production services that use any native extension. They strip the development tools but keep glibc, which is what most native code expects. Alpine uses musl libc instead, and that breaks common Python packages like NumPy, PyTorch, and confluent-kafka, which assume glibc is present. If your service compiles anything from source, stay on glibc. Alpine only earns its place when nothing has to compile.
Distroless images go further by removing the shell, package manager, and system utilities entirely. The DigitalOcean tutorial found that a distroless image carries 0 to 2 CVEs versus 30 or more on ubuntu:24.04. The Kubernetes project itself now runs on distroless base images.
The tradeoff with distroless: no shell means no docker exec -it ... sh for debugging. You trade operational convenience for a smaller attack surface. For teams with mature observability, that trade pays off. For teams still debugging by logging into containers, it hurts. If you are new to the container model, the fundamentals of containers versus VMs are worth understanding before you commit to a base image strategy.
Measure image size before changing anything
Before you change anything, measure. The InfoQ guide recommends running docker history on your image to see which layers contribute the most size. The command lists every instruction in your Dockerfile and shows exactly how much each step added.
The tool dive goes further. It shows a layer-by-layer breakdown of the filesystem, including which files were added, modified, or removed in each layer. On the 2.54 GB image from the InfoQ analysis, dive made it immediately clear that the pip install layer was the dominant contributor at 1.51 GB, followed by the base image at 560 MB.
For tracking over time, add an image size check to your CI pipeline. A simple script that runs docker image inspect with Docker's Size format field after each build and fails if the result exceeds a threshold catches regressions before they ship. The threshold should be generous at first, then tightened as you optimize.
The same CI check can surface the top three layers by size using docker history --no-trunc with Docker's Size and CreatedBy format fields, so the build log tells you exactly which instruction is responsible when the image grows past the limit. If you want a broader guide to writing Dockerfiles that hold up under pressure, see our guide to writing a Dockerfile that does not waste your time.
Ship less, deploy faster
The pattern is the same regardless of your stack: measure with dive, switch to a slim base, adopt multi-stage builds, and set a CI threshold. A team running 20 services with frequent deploys can save hundreds of dollars per month on storage and transfer, cut cold-start times from minutes to seconds, and shrink the attack surface by removing shells and package managers from production. The application code does not change. The Dockerfile does the work.
Sources
- InfoQ: Why Is My Docker Image So Big? A Deep Dive with 'dive' to Find the Bloat
- TechUnfiltered: Reduce Docker Image Size: Measure First, Then Cut
- DigitalOcean: Build Distroless Containers with BuildKit on Kubernetes
- Better Stack: Reducing Docker Image Sizes: From 1.2GB to 150MB
- Nick Janetakis: Shrink Your Docker Images by ~50% with Multi-Stage Builds