Data
$397 to $13 million: the public record of software prices
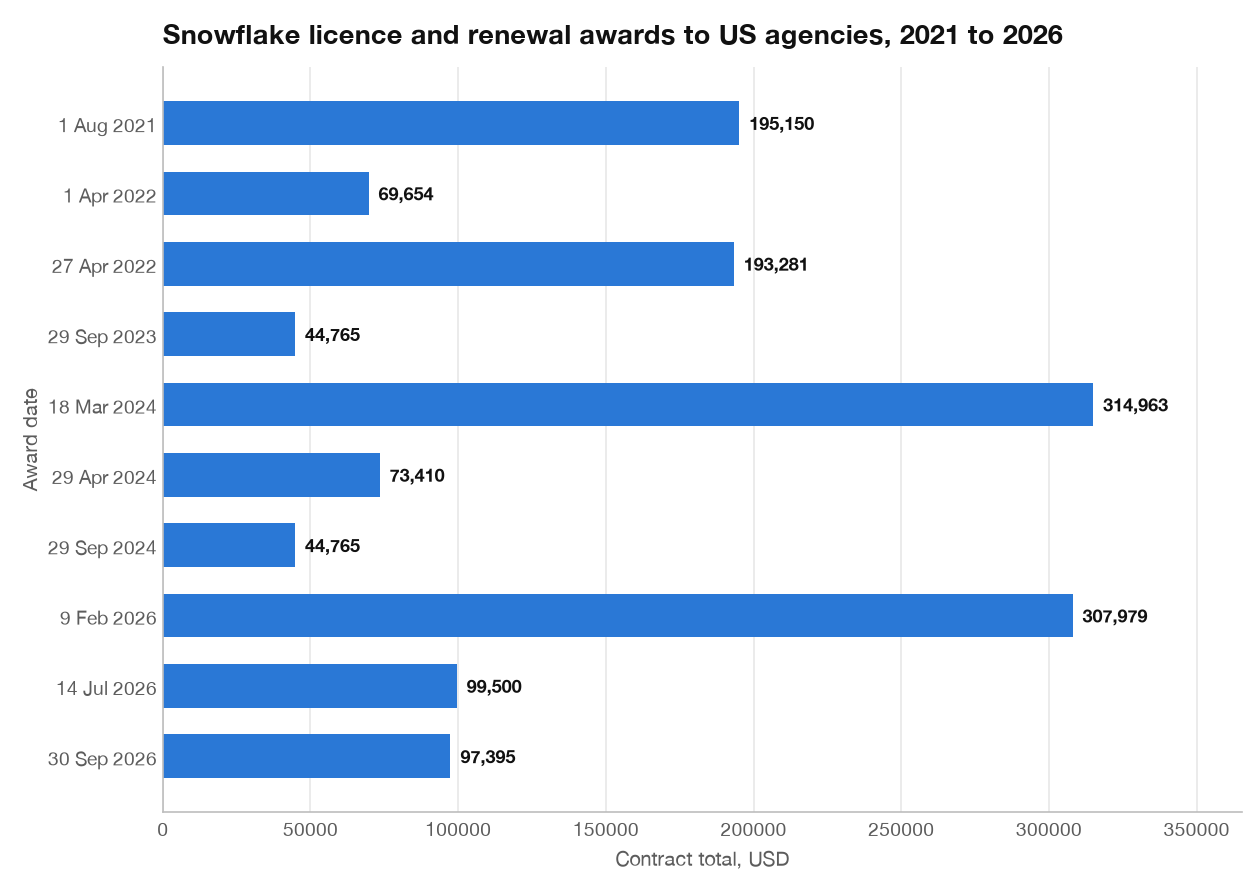
PriceProof turns USAspending awards into a checkable record of what US agencies paid for enterprise software, from Tableau at $397 to a $13 million contract.
The reporting on Data Today is built on open, versioned datasets. Browse the data-led stories below. Each one links to the figures and numbers behind it.
PriceProof turns USAspending awards into a checkable record of what US agencies paid for enterprise software, from Tableau at $397 to a $13 million contract.
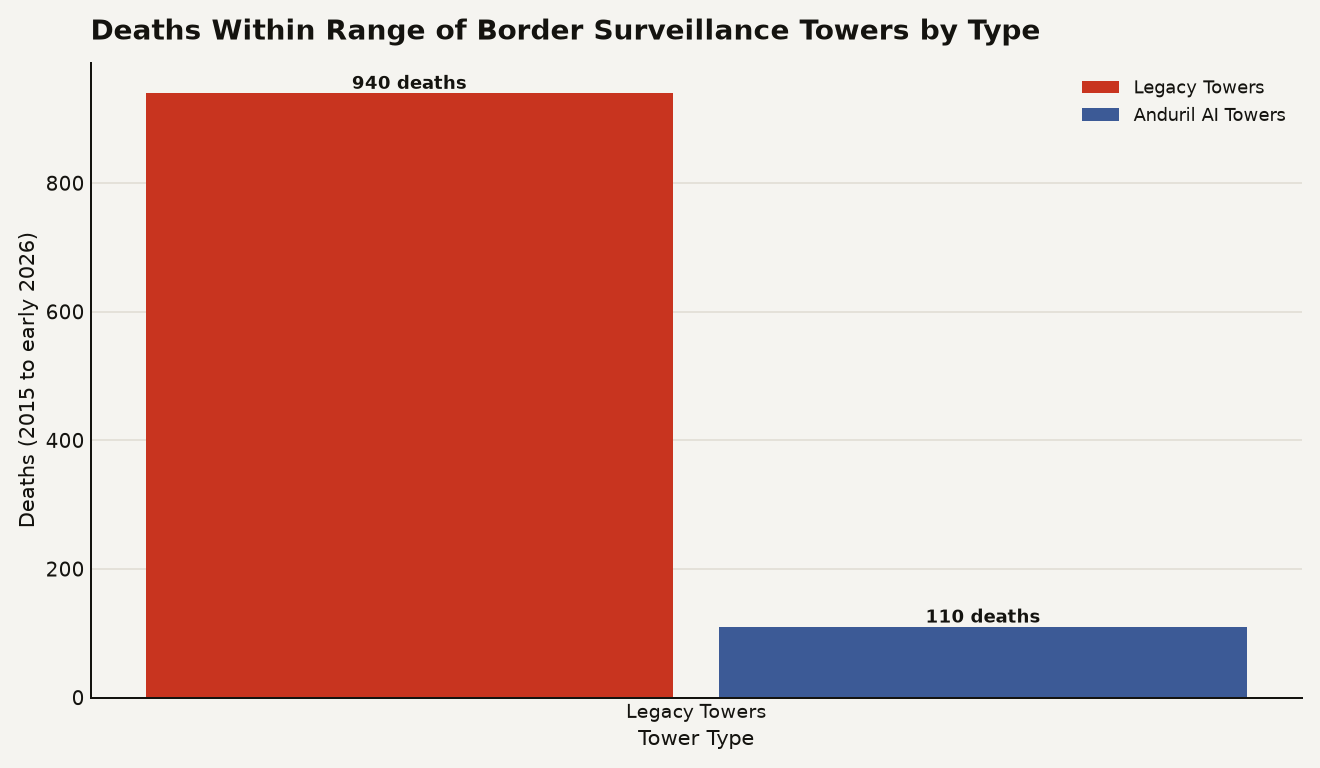
Border surveillance AI failed to prevent over 1,050 deaths within tower range from 2015 to 2026. MIT Tech Review mapped 4,000 remains against 600 towers, exposing detection gaps in the $6.2 billion virtual wall.
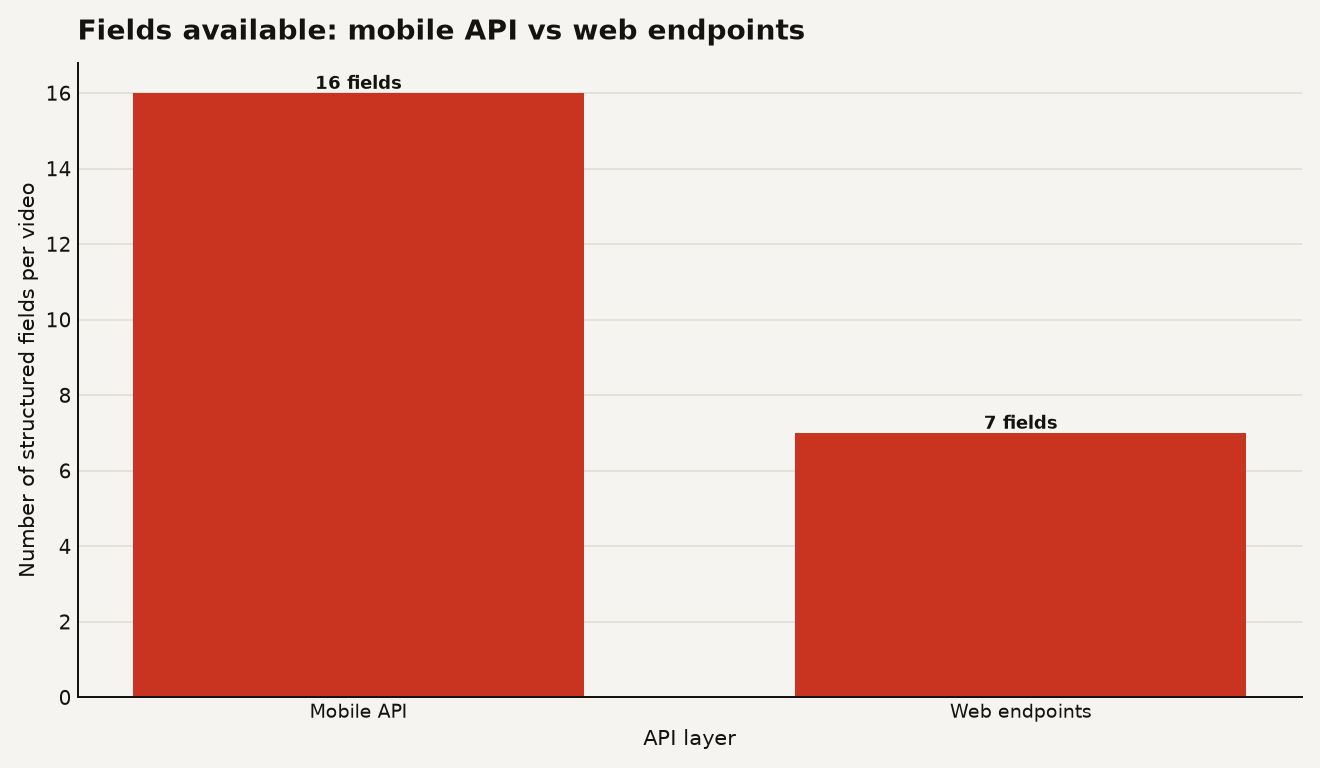
A reverse-engineered TikTok mobile API scraped 5.94 billion videos and 3.23 billion profiles in three weeks. 4.5 billion video records are now on Hugging Face as 289 GB of open data.
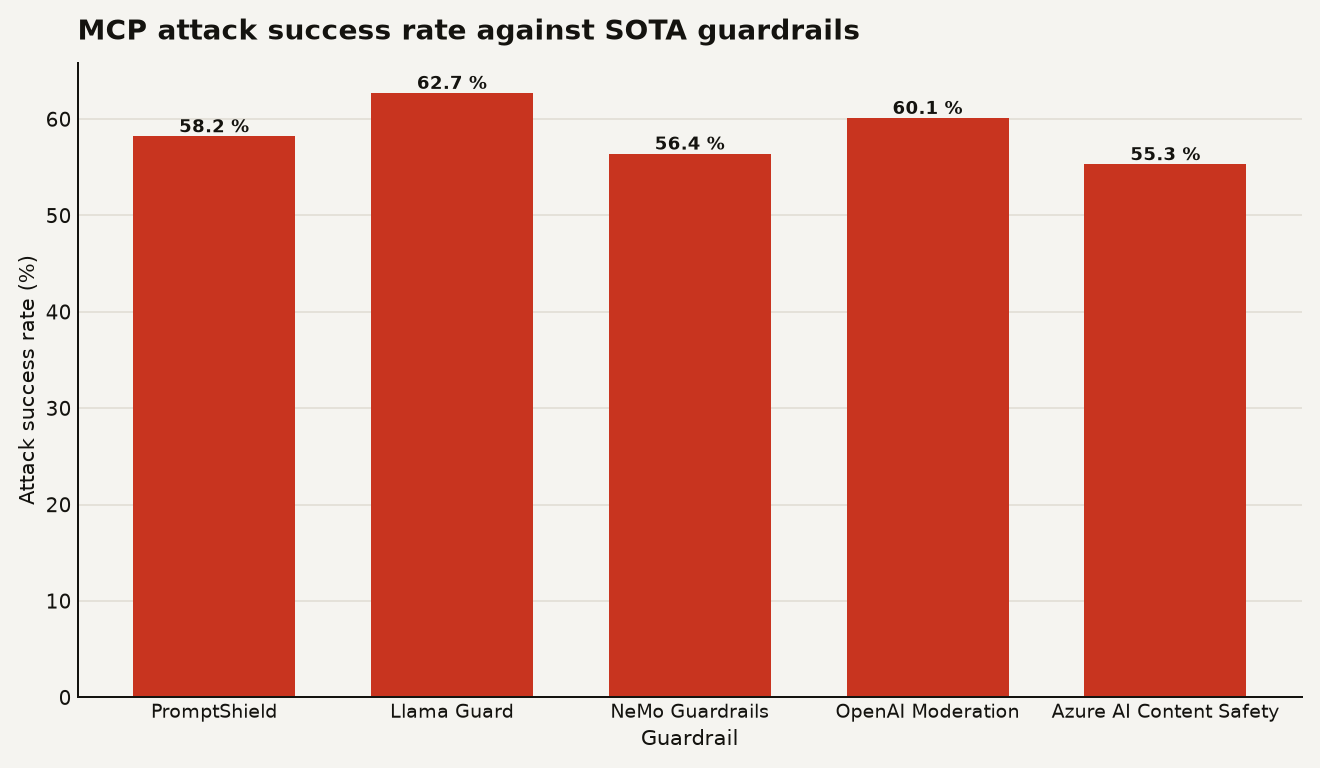
MCP attack chains bypass SOTA guardrails more than half the time because text classifiers miss composed tool-call exploits. The agentic safety gap is architectural, not a tuning problem.
From pixels and actions alone, the 5B-parameter MIRA world model simulates Rocket League with stable infinite rollouts at 20 fps on one B200.
A random 12-character password can outlast every computer on Earth, but an 8-character one on a weak hash falls in hours. Here is the brute-force math, mapped.
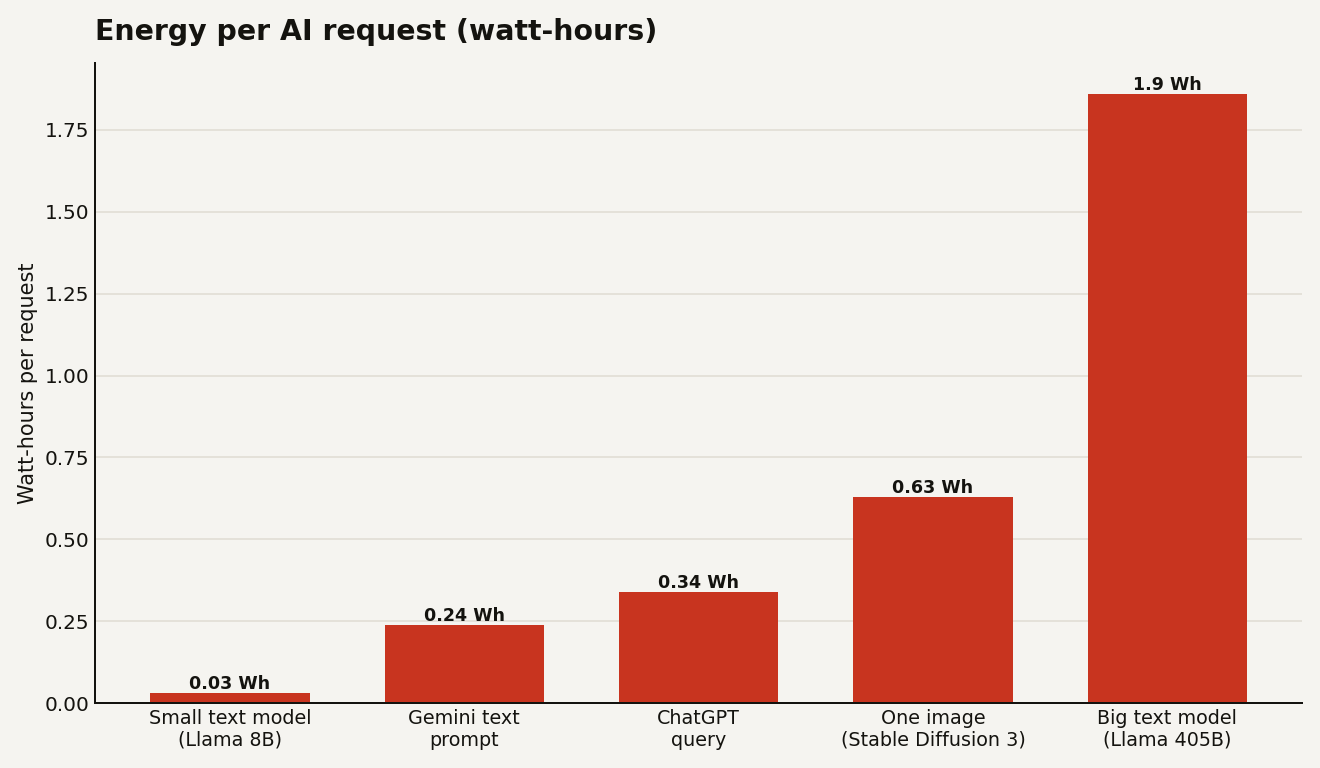
A typical AI text prompt uses roughly 0.24 to 0.34 watt-hours and a fraction of a milliliter of water, not a bottle per email. Training is huge but rare, and inference is what adds up.
EVA-Bench Data 2.0 is a 213 scenario dataset for testing enterprise voice agents across airline, IT, and healthcare HR workflows.
The United States holds about 75 percent of global GPU cluster performance. That concentration shapes pricing, latency, and policy for everyone building elsewhere.
Open-weight models went from a budget compromise to a default choice. On some benchmarks the gap to the best closed models shrank from 8 points to 1.7 in a year.
Every article in the Data section is built on an open dataset that you can download and check yourself. This page lists those articles, and each one opens with a link to the dataset behind it, placed before the first paragraph so you can see the source before you read the analysis.
We only file an article under Data when there is a real, downloadable dataset to point at: a public benchmark release, an open research corpus, a government statistics table, or a published data hub such as Epoch AI's. A blog post that summarises numbers does not count, and an article without a dataset goes in another section.
What each data-led article gives you:
The charts are published under the Creative Commons Attribution 4.0 licence: you may reuse them unaltered with credit to Data Today and a link to the article. The underlying datasets keep the licence their own publishers set, which is stated at the source.
Datasets change after we write about them: a benchmark adds models, a statistics office revises a series. The article's publication date tells you which version we used, and if a revision changes the conclusion we update the article and log the change.
If you reproduce a chart and get a different number, we want to know. The corrections address is on the contact page, and every substantive fix is logged on the corrections page.