Every AI lab publishes a usage report, and every AI lab decides what counts as a "use." Anthropic's Economic Index highlights productivity gains. OpenAI's consumer reports emphasize professional tasks. Google's ATLAS study maps 800 occupations and 4,000 tasks. What none of them tell you is what gets left out of the real picture of how people use AI. A new independent research project called the AI Observatory, led by researchers at Stanford and MIT, aggregated 24,521 real conversations from 5,000 users across 52 models between 2023 and 2025. When the team applied Anthropic's own filtering methods to their dataset, nearly 48% of conversations disappeared. The filtered-out content was disproportionately personal: health crises, relationship advice, harassment, sexual content, and adult topics.
That gap matters because policymakers, investors, and builders are making consequential decisions based on the filtered version. "There is no independent source to corroborate it," Anka Reuel, a Stanford PhD candidate who co-leads the project, told MIT Technology Review. The AI Observatory, built with researchers from MIT, Stanford, and the Data Provenance Initiative, is the first serious attempt to provide one.
The AI Observatory's independent data
The numbers tell a story company reports do not. The Observatory collected conversations from seven existing datasets, including WildChat, one of the largest public collections of real AI chat logs. The 24,521 conversations span 85,633 conversational turns and cover models from ChatGPT to Gemini to Claude to Grok.
When the researchers applied Anthropic's filtering criteria to this data, the differences were stark. The conversations that Anthropic's methods would exclude were far more likely to involve health and relationships (44.2% of filtered conversations versus 31.2% in Anthropic's published analysis), adult or illicit topics (7.9% versus 2.1%), harassment and hate (27.5% versus 5.66%), and sexual content (16.7% versus 2.4%).
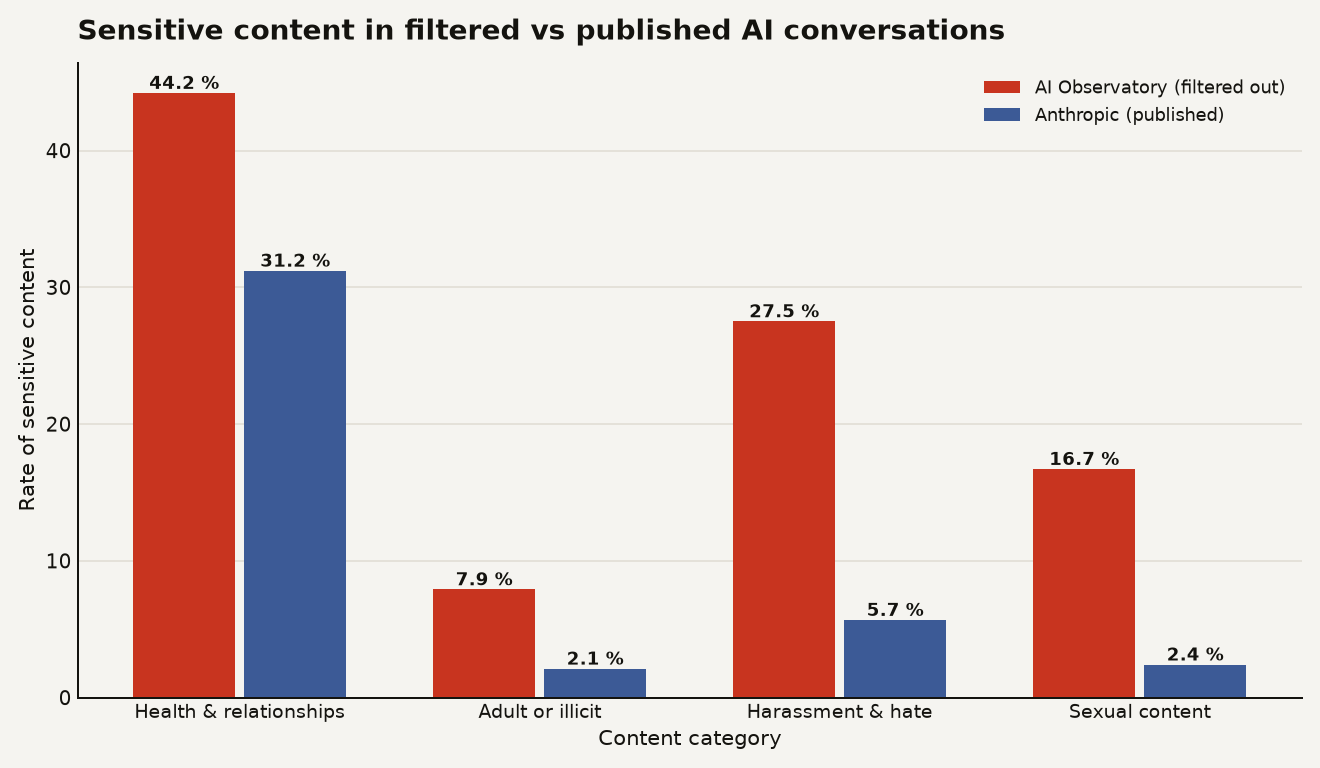
The chart above shows how the rate of sensitive content in the Observatory's unfiltered data dwarfs what appears in Anthropic's published analysis. Harassment and hate is nearly five times higher. Sexual content is seven times higher. These represent roughly half of what people actually talk about with AI, and they vanish from the reports that shape policy.
The Observatory also found that conversations grew longer and more elaborate over time, with increasing prompt tokens, response tokens, and conversation turns. Small talk increased, suggesting growing companionship use. Meanwhile, the AI's self-disclosure, meaning reminders that it is a chatbot, decreased. Sensitive exchanges, labeled as potentially harmful or restricted content, dropped over the same period, which may indicate that platforms are deploying more effective safeguards.
Company reports against independent data
Anthropic's Economic Index, one of the most widely cited sources of AI usage data, is based on analysis of 1 million Claude conversations, according to the same MIT Technology Review report. OpenAI's 2025 report on ChatGPT use analyzed 1.5 million conversations. Both are orders of magnitude larger than the Observatory's sample. But size alone does not guarantee completeness.
OpenAI's own report, produced with researchers from Harvard and published through NBER, found that only 30% of consumer ChatGPT use was related to work. Nearly 80% of all usage fell into three categories: Practical Guidance, Seeking Information, and Writing. Companionship and social-emotional issues accounted for just 1.9% of messages, though the Observatory's findings suggest the real figure may be higher when you include conversations that company filters would exclude.
Google's ATLAS v1.0 report, based on 15 million de-identified interactions with Gemini products, found that AI adoption spans occupations covering 88% of US employment but penetration remains shallow and collaborative. English queries represent only about a third of global volume. The OECD, using web traffic data, found that GenAI chatbot usage jumped from roughly 18% to 28% of the population across GPAI countries between January 2025 and January 2026, with Singapore reaching 63%.
Each of these sources captures a slice. None captures the whole. As Observatory co-lead Shayne Longpre, a recent MIT Media Lab PhD graduate, told the same report: "No single company report tells the whole story."
Usage differs sharply across models
The Observatory found that usage patterns differ dramatically across models, in ways that company reports do not surface. People used Grok and Gemini more frequently for information retrieval, with Grok particularly popular for news and politics, and also where misinformation tended to concentrate. People turned to Anthropic for coding, Gemini for social and roleplay uses, and ChatGPT for homework assistance.
Even within a single company's product line, usage shifted. Conversations with ChatGPT were shorter when powered by GPT-3.5 and longer and more iterative with GPT-4o, which became known for emotional attachment patterns. Company reports rarely capture these granular differences across model versions.
The OECD's web traffic analysis adds another layer: users of Claude and Microsoft Copilot are more likely to also visit LinkedIn, GitHub, and cloud platforms, while ChatGPT and Gemini users gravitate toward YouTube, Instagram, and Facebook. This browsing behavior reinforces the finding that different models serve different populations and purposes.
For builders, this matters. If you are designing a product on top of Claude's API, your users' behavior will look nothing like the behavior of someone building on Grok's. The safety implications, content moderation needs, and user expectations differ by model, by version, and by use case. A one-size-fits-all approach to AI safety, grounded in a single company's usage report, will miss the mark for half your users.
Practical steps for builders and researchers
The practical implications are immediate. If you are building AI products, making policy, or investing in AI companies based on company-published usage data, you are working with an incomplete picture. Here is what to do about it:
- Do not treat any single company report as ground truth. Anthropic's Economic Index filters out 48% of conversations. OpenAI's report acknowledges only 30% work-related use. Google's ATLAS captures Gemini interactions but not ChatGPT or Claude. Each captures a partial slice of reality.
- Use multiple data sources for product decisions. If you are building safety systems, content moderation, or user experience features, cross-reference company data with independent sources like the AI Observatory and the OECD's web traffic metrics. The gaps between them are where real user behavior lives.
- Push for data sharing in your contracts. The Observatory team hopes companies will share data with independent researchers in privacy-preserving ways. If you are a large enterprise customer, you are positioned to demand transparency about what your AI provider filters.
- Expect regulatory pressure to increase. The EU AI Act transparency rules are already taking effect, and regulators will want more than company-curated reports. Building internal data collection and analysis capabilities now will save scrambling later.
- Account for sensitive use in your safety planning. The Observatory found that filtered-out conversations had harassment and hate at 27.5%, compared with 5.66% in Anthropic's analysis. If your trust and safety team is calibrated to the published numbers, it is underestimating the problem by a factor of five.
What nobody can see yet
The Observatory's own dataset has a limitation the researchers acknowledge: it draws from voluntarily shared conversations, which means it likely underrepresents the most sensitive uses. People who ask AI for help with the most private, harmful, or illegal things are the least likely to consent to sharing those conversations. So the 48% filter rate is probably a floor. The real share of non-work, sensitive, or personal AI use is likely higher than any current dataset can show.
That means everyone making decisions based on AI usage data, from product roadmaps to regulatory frameworks, is operating with a systematic underestimate of the personal, sensitive, and sometimes harmful ways people actually use these tools. The Observatory is a start. But until AI companies open their logs to independent scrutiny, the most important data about how people use AI will remain the data nobody can see.
Sources
- MIT Technology Review - We still don't know how people are really using AI
- NBER Working Paper 34255 - What are people using ChatGPT for?
- OECD.AI - How people are using GenAI chatbots: Evidence from web traffic data
- Google AI Blog - The first ATLAS report on AI