Most LLM benchmarks are photographs. A model gets evaluated once, a number gets published, and everyone treats that number as if it describes a stable object. But the model behind an API endpoint is not a frozen artifact. Providers swap weights, update tokenizers, change inference engines, adjust quantization, reroute traffic across different hardware, and almost none of this shows up in a changelog. The score on your leaderboard from Tuesday may describe a different model than the one answering your requests on Friday.
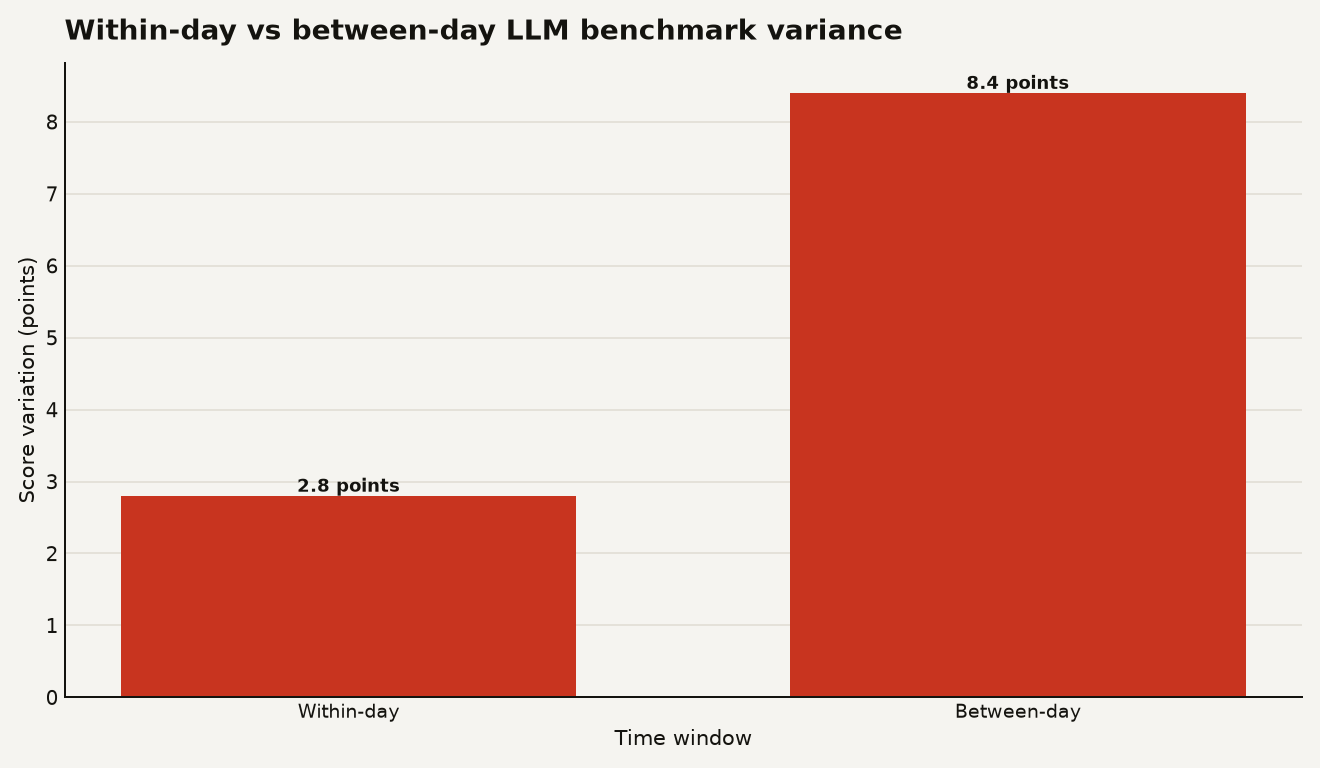
LLM performance drift, the measurable change in model behavior on API-served endpoints over time, is now quantifiable thanks to continuous evaluation pipelines that run the same tasks repeatedly. A dataset of 31,352 hourly benchmark scores across 49 model identifiers from multiple providers found that between-day variation averages 8.4 points on a normalized 0 to 100 composite, roughly three times the 2.8-point within-day variation. If you are building on LLM APIs and treating a single benchmark run as ground truth, you are reading a photograph of a moving target.
31,352 hourly measurements
The analysis, shared on r/MachineLearning by the developer of the open-source AIStupidLevel system, ran a continuous evaluation pipeline testing models across coding, deep reasoning, tool calling, and high-frequency canary tasks. Coding responses were executed rather than judged through model-based evaluation alone. Tool-calling tests required models to select tools, construct valid arguments, and complete workflows inside isolated Docker environments. Each task ran five times, with results aggregated to reduce the influence of unusually strong or weak generations.
The core finding was a variance split. Within the same day, scores moved 2.8 points on average. Between different days, that movement jumped to 8.4 points. The between-day variance was approximately three times the within-day variance, which means isolated hourly movements are dominated by normal model stochasticity. The chart below shows the gap between the two windows.
Sustained changes across daily evaluation windows provide a materially stronger signal for detecting real performance drift. The detection pipeline aggregates repeated measurements into daily medians and applies sequential change-point detection. Potential incidents must persist beyond the expected historical variance and pass both statistical and minimum-effect thresholds before being classified as degradation or recovery.
The system has since grown well beyond the initial dataset. It now comprises 169,858 benchmark runs, 104,458 measured scores, and 88 million-plus processed tokens across 81 historical model identifiers, 22 currently monitored models, and 6 active providers. The live dashboard classifies models as stable, volatile, degraded, or recovering, with separate measurements for coding, reasoning, tool use, reliability, latency, and price. At the time of the original post, the system had detected a 32 percent sustained performance decline in Gemini 3.1 Flash Lite and classified it as a critical incident. No announced update accompanied that decline.
Between-day variance exceeds the noise floor
The 2.8-point within-day spread is your noise floor. It is the expected jitter from sampling, from minor differences in batching, from the inherent stochasticity of next-token prediction even at low temperature. If you run a benchmark once and see a model drop 3 points, you have learned nothing. You are reading noise.
The 8.4-point between-day spread is where signal lives. When a model's score moves consistently across a full day of repeated measurements, something structural has changed. The provider may have pushed a weight update, switched a quantization level, changed the inference engine, or rerouted traffic to different hardware. The AIStupidLevel pipeline addresses this by aggregating repeated measurements into daily medians and applying sequential change-point detection. Potential incidents must persist beyond the expected historical variance and pass both statistical and minimum-effect thresholds before being classified as degradation or recovery.
This maps to a problem anyone running production LLM applications will recognize. Your error rate ticks up on Wednesday. Is it the model, or is it your prompt, or is it Tuesday's traffic pattern? Without a baseline for expected variance, you cannot tell. The AIStupidLevel data gives you that baseline: expect about 2.8 points of movement within a day from noise alone, and start paying attention when daily medians shift by more than that.
A separate project, model-drift on GitHub, takes a similar median-based approach. It probes each model three times per night and records the median, so a number only moves when two of three runs agree. In one revealing test, three runs of an identical frozen suite executed half an hour apart moved Claude Sonnet 5 by 9 points and Fable 5 by 6 points, while 11 of 16 models did not move at all. Same questions, same deterministic grader, same day. None of the 16 models accept a temperature parameter, so nothing can be pinned to zero. That spread is the floor under any drift signal, and any monitoring system that alerts on a single run is alerting on sampling noise.
Independent projects tracking silent drift
The AIStupidLevel project is one of several independent efforts tackling the same problem from different angles. What they share is a rejection of the snapshot model of evaluation.
Stability Monitor, described in a paper on arXiv, takes a black-box approach to endpoint fingerprinting. It periodically samples outputs from a fixed prompt set and compares the resulting output distributions over time using a summed energy distance statistic. Each fingerprint requires 800 inference requests, each consisting of a few tokens. The system uses sequential evidence accumulation based on e-values to enable continuous monitoring with optional stopping, suited for streaming detection. In controlled validation, it detected changes to model family, version, inference stack, quantization, and behavioral parameters. In real-world monitoring of the same model hosted by multiple providers, it observed substantial provider-to-provider and within-provider stability differences.
The paper makes a point that anyone shopping for LLM APIs should internalize: even if you fix visible settings like temperature, endpoint behavior can vary due to system-level nondeterminism beneath the surface. Variance in inference engines, kernels, caching, batch sizes, and hardware means providers may route requests across heterogeneous environments as a function of system load. The same model served by different providers can exhibit different behavioral characteristics, which matters for selecting production providers and for interpreting benchmark results that depend on provider access paths.
IBM's BenchDrift project, also on arXiv, approaches drift from a different angle: rephrasing. The paper, titled "The Wording Effect," quantifies two-way drift caused by changing the wording of benchmark questions while keeping the underlying task identical. It finds that rephrasing breaks answers a model was confident about, whether the problem is made shorter or longer. The fragility belongs to the rephrasing and not to the model, but the effect is real enough to corrupt evaluation results. If your internal eval suite has evolved over time, with prompt tweaks and reformulations, your historical scores are not directly comparable to your current ones.
SEISMOGRAPH, described on dev.to, is another open-source early-warning network for silent drift in third-party LLM APIs. It frames the problem as the 2am question: did the model change underneath you, or is your prompt simply worse today?
Protecting your app from drift
The practical takeaway from this body of work is straightforward. If you are building on LLM APIs, you need continuous evaluation the same way you need uptime monitoring. Here is what that looks like:
- Run your own canary tasks on a fixed schedule. Pick 20 to 50 tasks that represent your actual workload, not generic benchmarks. Run them hourly or daily against every model endpoint you depend on. Aggregate to daily medians. The AIStupidLevel data shows that hourly scores move 2.8 points from noise; only daily medians carry signal.
- Track the spread alongside the score. The model-drift project stores the accuracy spread across runs on every data point rather than smoothing it away. If your median moves 4 points but the spread is 9 points, you have a jitter problem, not a drift problem. If the median moves 4 points and the spread tightens, something real changed.
- Monitor provider-to-provider differences. The Stability Monitor paper found that the same model hosted by different providers can exhibit different behavioral characteristics. If you are routing across providers for redundancy, you may be routing across different effective models. Test each provider endpoint independently.
- Set alerting thresholds above the noise floor. A single benchmark run that drops 3 points is noise. A daily median that drops 3 points for two consecutive days is signal. The AIStupidLevel pipeline requires incidents to persist beyond expected historical variance and pass statistical and minimum-effect thresholds before classification.
- Assume silent updates are happening. Model providers ship changes without version bumps. The AIStupidLevel system detected a 32 percent decline in Gemini 3.1 Flash Lite without any announced update. Your monitoring needs to catch what the changelog will not tell you.
For teams already using model routing layers, this monitoring dimension is additive. The AIStupidLevel dataset also powers an OpenAI-compatible router that selects models based on current task-specific performance, stability, tool-calling reliability, latency, and cost. This is the same direction Stripe's acquisition of OpenRouter points: routing decisions need real-time performance data, not just price and latency.
The denominator problem
Every drift detection system eventually hits the same wall: you need a denominator. A 5-point drop means nothing if your normal variance is 10 points. It means everything if your normal variance is 1 point. The AIStupidLevel dataset provides that denominator for the first time at scale: 2.8 points within a day, 8.4 points between days. Those numbers are the calibration your alerting thresholds need.
The broader lesson is that benchmark scores are not properties of models. They are properties of a specific model, on a specific provider, on specific hardware, at a specific time, evaluated with specific prompts. Treat them accordingly. Build the monitoring pipeline, run the canaries, track the spread, and stop trusting photographs of moving objects.
Sources
- Reddit r/MachineLearning - Measuring LLM performance drift: observations and methodology from 31,352 repeated benchmark measurements
- AIStupidLevel - Live dashboard and continuous evaluation dataset
- arXiv - Stability Monitor: black-box stability monitoring for LLM endpoints
- arXiv - The Wording Effect: Quantifying Two-Way Drift in LLM Benchmark Performance
- GitHub - egnaro9/model-drift: nightly drift detection with median aggregation
- dev.to - SEISMOGRAPH: open-source early-warning network for silent LLM API drift