Your model evaluation may be lying to you, and the clock is partly to blame. A new analysis of 31,352 hourly LLM benchmark scores found that performance on identical prompts swings by 8.4 points between different days and 2.8 points within a single day. If you ran your eval once on a Tuesday afternoon and once on a Friday morning, you might conclude a model got meaningfully better or worse when nothing changed except the time stamp.
The findings come from a longitudinal benchmarking effort that queried major LLM API endpoints continuously, recording time to first token, total latency, and generation throughput every hour. The raw data is published openly, which means anyone can re-run the analysis and check the claim. This matters because the conventional wisdom in model selection is that a benchmark score is a fixed property of a model snapshot plus a prompt. The evidence increasingly says otherwise.
A separate study on arXiv reinforces the pattern. Researchers queried GPT-4o (snapshot gpt-4o-2024-08-06) on a physics task ten times every three hours for roughly three months, producing 6,930 total queries. They found that about 20% of total variance in performance was attributable to periodic daily and weekly rhythms, and that the periodic structure alone produced peak-to-peak fluctuations of roughly 14% of the full scoring scale. The model did not drift over the full study period. It oscillated.
What exactly did the 31,352-score analysis find?
The Reddit analysis, posted to r/MachineLearning on August 29, 2026, drew on a continuous hourly benchmarking dataset that tracks major LLM API endpoints. The infrastructure behind it is open source: a probe called llmprobe sends a minimal request to each tracked model every hour and records time to first token (TTFT), total latency, and tokens per second after the first token. Results are committed as JSONL files, organized by month and day, and a static dashboard renders time series charts.
The key finding was the gap between within-day and between-day variation. Within a single day, scores varied by about 2.8 points. That is noise you might tolerate, especially if you average multiple runs. Between days, the swing was 8.4 points, roughly three times larger. The implication is that day-to-day factors, which could include provider-side load balancing, batch processing schedules, or infrastructure changes, dominate the signal.
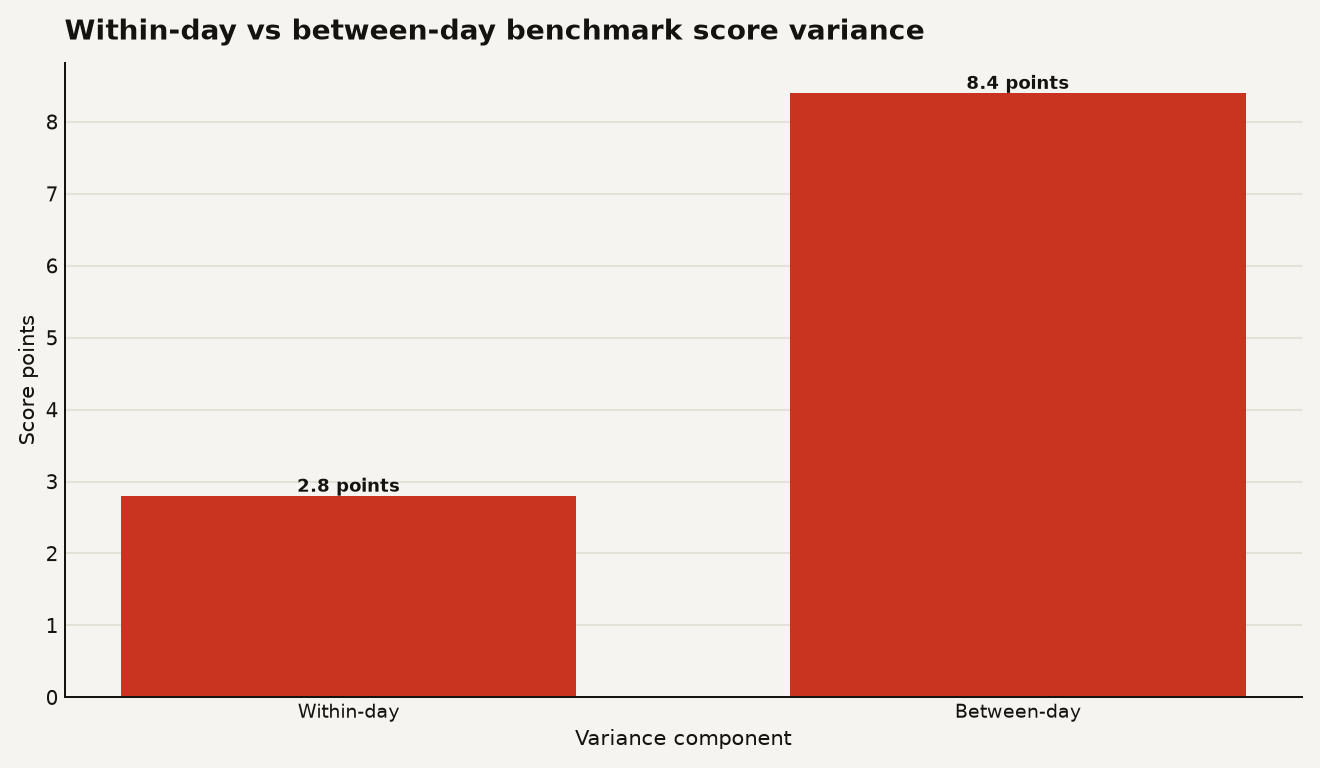
The chart above shows the two variance components side by side: the 2.8-point within-day swing and the 8.4-point between-day swing, based on the 31,352 hourly measurements. The between-day variance is the one that should worry you, because it means the calendar date of your eval run is a confounding variable.
The underlying dataset is real and downloadable. Each JSONL record includes the provider, model, status, TTFT in milliseconds, total latency in milliseconds, tokens per second, token count, and an ISO timestamp. Here is a sample record from the published schema:
{
  "provider": "openai",
  "model": "anthropic/claude-sonnet-4.6",
  "status": "healthy",
  "ttft_ms": 312,
  "latency_ms": 2100,
  "tokens_per_sec": 68.4,
  "token_count": 20,
  "timestamp": "2026-05-06T14:00:00Z"
}
The arXiv study adds spectral rigor. The researchers ran a Fourier analysis on the GPT-4o time series and found significant periodic components at both daily and weekly frequencies. An ordinary least squares regression showed no systematic linear drift over the three-month window (the drift coefficient was not significant at p = 0.303), which means the model was not getting better or worse over time. It was cycling. The interaction between daily and weekly rhythms meant that performance at 3 PM on a Wednesday was not the same as 3 PM on a Saturday, even with identical prompts, model snapshot, and temperature.
The arXiv paper also quantified what was left unexplained. Even with 10 repetitions per time point, approximately 80% of variability remained unexplained by temporal periodicity. That remaining variance is sampling noise plus unmeasured provider-side factors, and it is the reason a single benchmark run is unreliable regardless of when you take it.
Why does time-dependent variance matter for your stack?
If you are building anything that depends on LLM output quality, this changes how you should think about evaluation and model selection. The practical consequences land in four places:
- Model selection decisions. If you compare two models by running each once, the 8.4-point between-day variance can flip the result. You might pick Model A over Model B because you happened to eval Model A on a good day and Model B on a bad one. A difference of 8 points is large enough to change procurement decisions, especially in the mid-tier where models cluster within a few points of each other, as we noted in our coverage of the AI model price war.
- Regression testing. If your CI pipeline runs an LLM eval suite on every commit and the score drops 3 points, was it your prompt change or was it Tuesday? Without a baseline that accounts for temporal variance, every regression alert is ambiguous. You will either ignore real degradations or chase phantom ones.
- A/B testing in production. If you route traffic between two model versions and measure quality over a few hours, the within-day variance of 2.8 points can swamp a real improvement of 1 or 2 points. You need longer observation windows and more repetitions to reach statistical significance.
- Research reproducibility. The arXiv authors flag this directly. If a paper reports an LLM benchmark score from a single session, that score is a sample from a time-varying distribution, not a fixed property. Replication attempts at different times of day or week may fail for reasons that have nothing to do with the model or the prompt.
The financial angle is real too. If you are paying per token and your eval suite runs thousands of queries, spreading those queries across a full week to get an unbiased estimate of performance is more expensive than running them in a single burst. The arXiv paper acknowledges this tension and recommends at least one full week of evenly spaced sampling with hourly resolution and multiple repetitions per time point. That is a meaningful API cost for a large eval suite, but it is cheaper than shipping the wrong model.
How should you change your evaluation pipeline?
The fix is straightforward but not free. Here is what a robust eval pipeline looks like given this evidence:
First, run your eval suite multiple times per day across at least one full week. The arXiv authors found that the weekly periodicity was the longest cycle, so sampling must span at least one week to capture it. If you sample only on weekdays, you miss the weekend pattern. If you sample only during business hours, you miss the overnight behavior.
Second, average multiple repetitions per time point. The stochastic nature of LLM outputs means even identical prompts at the same time produce different responses. The arXiv study used 10 repetitions per three-hour window and still had 80% unexplained variance. If you are running one query per eval case, your noise floor is far higher than your signal.
Third, treat benchmark scores as distributions, not point estimates. Instead of reporting "Model A scored 78.4," report the mean, standard deviation, and the time window over which you measured. If the standard deviation is 3 points, a 2-point improvement is not significant. This is standard practice in any other measurement discipline, and it should be standard for LLM evals too.
Fourth, lock the time window when comparing models. If you are comparing two models, run them in the same hours of the same days, ideally interleaved. If Model A runs on Monday and Model B runs on Wednesday, the 8.4-point between-day variance contaminates the comparison. Interleaving means alternating queries between models at each time point, so both models see the same temporal conditions.
Fifth, track latency and throughput alongside accuracy. The llm-bench dataset records TTFT, total latency, and tokens per second because performance is multidimensional. A model that scores 2 points higher on accuracy but takes 3 seconds longer to first token may be the wrong choice for a latency-sensitive application. The hourly data lets you see whether latency degrades at peak load times even when accuracy holds steady.
What are the open questions?
The analysis raises questions that neither the Reddit post nor the arXiv paper fully answers. The biggest one: what causes the between-day variance? The candidates are provider-side load balancing, traffic-dependent routing between serving clusters, background model updates that are invisible to API users, and differences in GPU utilization patterns across the week. Providers do not publish the details of their serving infrastructure, and the overload-error pattern (429 and 529 status codes) is heavily diurnal, as noted in a diurnal drift analysis from earlier in 2026.
The 429 and 529 error curves themselves show daily and weekly structure, which means capacity strain is not uniform. If your eval suite hits a rate limit during a peak hour and you retry later, your results are contaminated by the retry. If you discard the failed queries, your results are biased toward off-peak performance.
Another open question is whether the variance pattern generalizes across models and providers. The arXiv study tested one model (GPT-4o) on one task type (physics). The Reddit analysis drew on a broader set of models but focused on throughput and latency metrics rather than accuracy. A model served on a smaller fleet with less load balancing may show more variance, while a model on a massive fleet with aggressive routing may show less. The answer likely varies by provider and by model popularity.
A third question is whether the variance shrinks as providers invest in capacity. Both OpenAI and Anthropic have visible peak-hour capacity strain in 2026, but if they close the gap between peak and off-peak performance, the temporal variance may attenuate. Until then, the clock remains a confound.
The bottom line
The single benchmark run is dead. It was never alive in the first place; we just pretended it was because the alternative was expensive and inconvenient. Now the data is public, the methodology is published, and the variance is large enough to flip decisions. If you are choosing models, shipping eval pipelines, or publishing research based on LLM performance, you need to treat time as a variable. The 8.4-point swing between days is not a rounding error. It is the difference between shipping the right model and shipping the one that happened to be in a good mood on the day you tested it.
Sources
- arxiv.org Daily and Weekly Periodicity in Large Language Model Performance and Its Implications for Research
- github.com Jwrede/llm-bench: 24/7 LLM API benchmark infrastructure and open dataset
- reddit.com I analyzed 31,352 hourly LLM benchmark scores (r/MachineLearning)
- tianpan.co The Same Prompt at 3 PM and 3 AM Is Not the Same Prompt: Diurnal Drift in LLM Evaluation