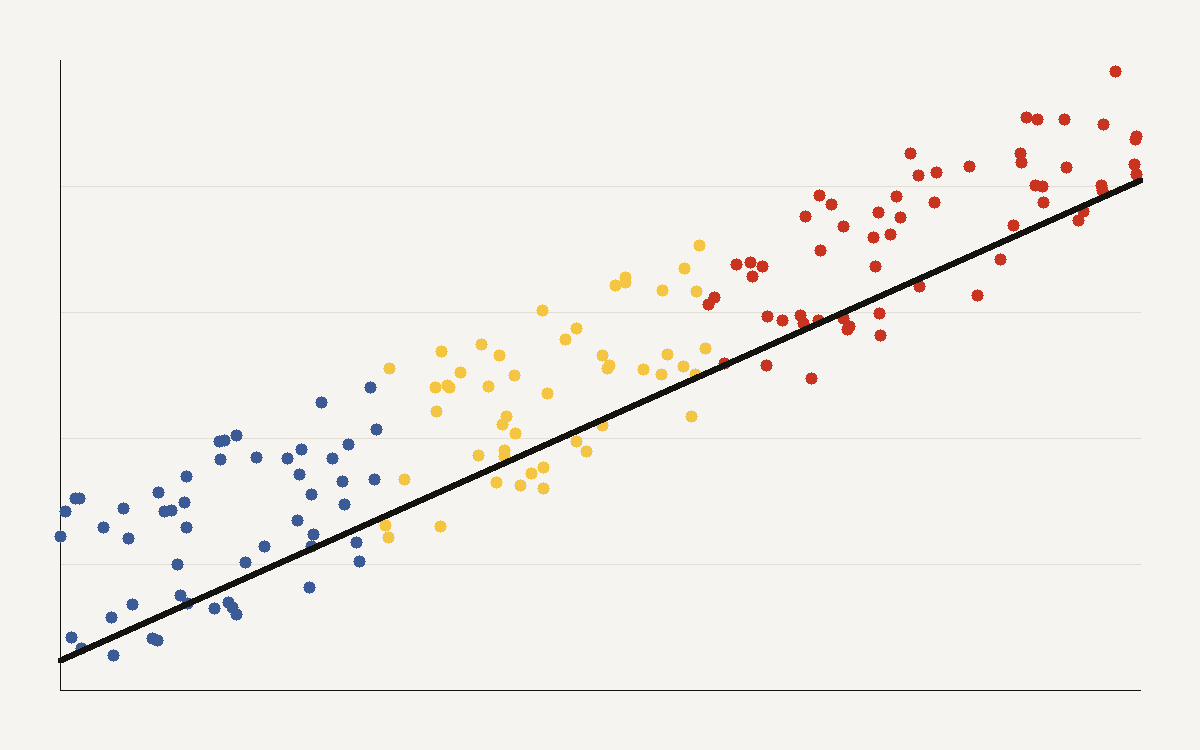
Scaling laws are the closest thing modern AI has to physics. The scatter above, plotting capability against training compute, fits a line almost too well. According to Epoch AI, training compute for frontier language models has grown about 5 times per year since 2020, a roughly ten-thousand-fold increase among the top systems. The real question is how far that line goes.
The drivers are not free. The cost of frontier training runs rises about 3.5 times per year, and power use roughly doubles annually. Working the other way, algorithmic efficiency improves about 3 times per year, so the same capability costs less compute over time. The curve is a race between rising scale and falling unit cost.
Fit a line to the published points and the slope is steady: each tenfold increase in training compute buys a roughly constant bump in benchmark capability. That straight line on a log scale is exactly what makes the next paragraph dangerous. A clean trend invites you to read the future straight off the ruler.
Two ways to be wrong
- Extrapolate naively and you promise miracles at the next order of magnitude.
- Assume a wall and you under-invest right before the payoff.
The data cannot settle which is right, because every point sits to the left of the question. We are, by definition, fitting a line we hope to leave behind. Epoch argues the inputs can keep scaling through 2030, which is a statement about supply, not about whether capability keeps tracking it.
A reporter's caveat
Treat any chart that ends in an arrow with suspicion. The most expensive mistakes in this field have all been confident extrapolations of a clean-looking curve, and the people paying the gigawatt-scale bills are betting it holds. The underlying compute trends are documented by Epoch AI.
What the curve can and cannot say
The scaling curve is evidence that more training compute has produced more capability across recent frontier systems. It is not a guarantee that the next tenfold increase will buy the same gain. The fitted line describes the range of models already built. The most important decisions sit just beyond that range.
That limitation does not make the chart useless. It makes the chart a disciplined starting point. A clean relationship across many releases tells investors, engineers, and policymakers that scale has worked so far. It also tells them which assumption they are making when they fund the next order of magnitude.
The danger is false certainty in either direction. A skeptic can point to rising costs and declare the wall near. An optimist can point to the line and declare the future solved. The data supports neither posture fully. It supports a more careful claim: recent progress has been strongly associated with scale, and the next test is expensive.
Why extrapolation is still tempting
Companies extrapolate because the alternative is harder. If a lab believes the line will continue, it can justify more compute, larger data centers, and deeper partnerships. If it believes the line will break, it should redirect money into efficiency, data quality, productization, or narrower models. The investment choice forces a view before the evidence is complete.
That is why scaling debates become emotional. They are not only technical. They decide who gets capital, which teams hire, which countries subsidize infrastructure, and which vendors win enterprise commitments. A curve on a log chart becomes a capital-allocation argument.
The responsible version of extrapolation includes milestones. A lab can fund the next scale step while naming the capability gain it expects, the cost ceiling it will tolerate, and the evidence that would cause it to slow down. Extrapolation without stop conditions is faith. Extrapolation with measurement is strategy.
The role of efficiency
Algorithmic efficiency complicates the story in a useful way. If the same capability requires less compute each year, then scale is not the only path to progress. Better data, architectures, training recipes, inference methods, and tool use can shift the curve. That means a smaller model in the future may match a larger model today.
Efficiency also widens access. Frontier labs may spend more to move the leading edge, while the rest of the market benefits as techniques diffuse. Today's expensive capability becomes tomorrow's commodity feature when efficiency gains and hardware improvements meet.
This diffusion is why scaling can be both centralized and democratizing. The frontier run may require enormous capital, but the lessons from that run can lower costs for everyone else. The social question is who captures the value between those two moments.
What readers should take from the chart
The chart is interesting because it is both persuasive and incomplete. It shows why serious actors keep paying for more compute. It also shows why those actors are exposed if the relationship weakens. The same line that supports the boom defines the risk.
For a product team, the conclusion is practical. Assume model capability will keep improving, but avoid building a business that only works if the most optimistic extrapolation arrives on schedule. For a policymaker, the conclusion is similar: infrastructure decisions should recognize the trend without treating it as destiny.
The scaling curve deserves attention because it has been a good map. The warning is that maps are most dangerous at the edge, where the road has not been built yet.
The investment test
The best use of the curve is to make assumptions explicit. If a company funds a larger run, it should state the capability gain it expects, the product value of that gain, and the evidence that would change the plan. If a policymaker funds power or data-center capacity, the same discipline applies. What outcome would make the investment look wise, and what outcome would make it look premature?
Those questions do not remove uncertainty. They make it auditable. Scaling may continue to work, but the cost of testing it is now large enough that vague optimism is a weak substitute for measured milestones.