Power BI pricing looks simple until you add up the real numbers. A Pro license costs $10 per user per month. For a 200-person organization, that is $2,000 per month, or $24,000 per year. But Pro licenses only cover report authoring and consumption within shared capacity. As soon as you need paginated reports, AI features, deployment pipelines or more than 1 GB of semantic model size, you need Premium capacity. And since Microsoft Fabric launched in 2023, the licensing model has merged Power BI Premium with the broader Fabric platform, turning what used to be a BI cost into a data platform cost.
The three FinOps levers for Power BI are license tier auditing, capacity right-sizing and report lifecycle management. Get these right and your Power BI bill reflects what your organization actually uses. Get them wrong and you are buying Premium capacity for users who only consume reports, or paying for Fabric capacity that sits idle because the data engineering team has not adopted it yet.
Pro at $10 per user is the entry point
Power BI Pro at $10 per user per month is the entry point. Every user who creates, publishes or shares reports needs a Pro license. Every user who consumes reports published to shared capacity also needs a Pro license unless the organization has Premium capacity (which includes a limited free consumption tier). The most common FinOps mistake on Power BI is overbuying Pro licenses: a user who only views one dashboard per quarter does not need a $120 per year license.
Power BI Premium Per User (PPU) at $20 per user per month adds AI features (AutoML, cognitive services integration), larger semantic models (up to 100 GB), and higher refresh rates (up to 48 times per day). PPU makes sense for power users who author complex reports and data analysts who build semantic models. It is waste for report consumers.
Power BI Premium capacity is the organization-wide license that replaces per-user licensing for report consumers. Premium P1 costs $4,995 per month and includes 8 v-cores of dedicated capacity, unlimited report consumption for users without Pro licenses, and advanced features like paginated reports, deployment pipelines and XMLA endpoints. Premium P2 ($9,995 per month) doubles the capacity. Premium P3 ($19,995 per month) quadruples it.
Microsoft Fabric SKUs have largely replaced the standalone Premium SKUs for new customers. Fabric F2 through F2048 are capacity-based licenses that include Power BI, Data Factory, Synapse, and all other Fabric workloads. An F64 SKU (the smallest that includes full Power BI Premium features) costs roughly $8,500 per month at list price with no commitment discount. An F128 costs $17,000 per month. Fabric SKUs are priced per capacity unit (CU), where 1 CU is roughly $0.18 per hour at list price.
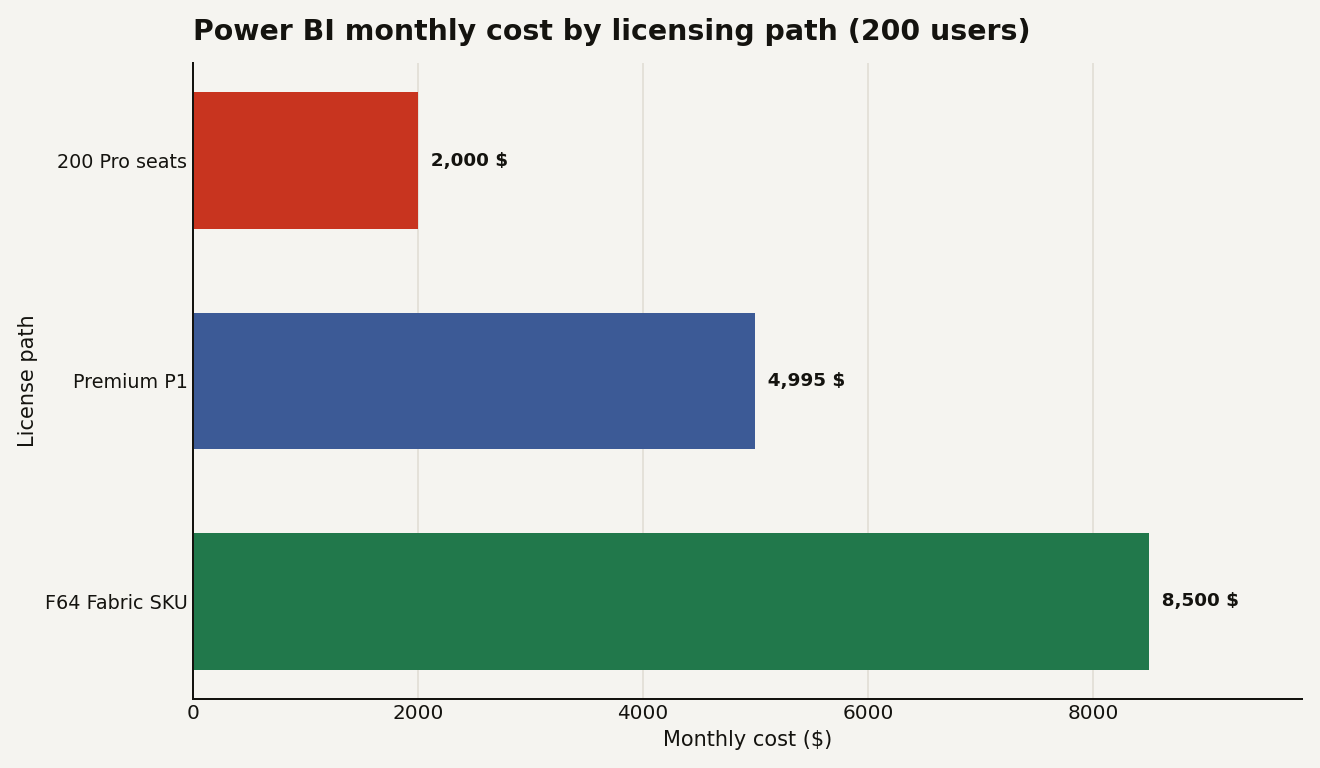
The Fabric pricing model means that Power BI cost is no longer a standalone number. Your Fabric capacity serves Power BI workloads alongside data engineering, data science and data warehouse workloads. A Power BI report that refreshes every 15 minutes consumes CUs that could otherwise be used for a Spark job. The FinOps challenge is no longer just "how much does Power BI cost?" but "how much of the Fabric capacity is Power BI consuming, and is that the right split?"
License tier auditing is the fastest win
License tier auditing is the fastest win. Export your user list from the Microsoft 365 admin center or the Power BI admin portal. For each user, map their license tier (Free, Pro, PPU) against their actual activity: report views, report publishes, dataset refreshes, and last sign-in date. The Power BI activity log provides this data through the Microsoft 365 unified audit log or the Power BI REST API.
The typical audit finds 15 to 25 percent of Pro licenses are underused or unused. A user who last signed in 90 days ago and has zero report views in that period is paying $30 for nothing. A user who only views reports and never creates them is a candidate for free consumption tier if the organization has or upgrades to Premium capacity. A user on a PPU license who never uses AI features or builds models larger than 1 GB is a candidate for a standard Pro license.
Capacity right-sizing is the second lever. Power BI Premium and Fabric capacities are measured in capacity units (CUs), and overloading a capacity causes throttling: report loads slow down, refreshes queue up, and interactive operations time out. The capacity metrics app (available in the Power BI admin portal) shows CU utilization over time, broken down by workload (interactive operations, scheduled refreshes, background operations, AI operations).
The right-sizing playbook: monitor CU utilization at 15-minute granularity for two weeks. If maximum utilization stays below 60 percent, you have headroom for growth or a smaller SKU. If utilization regularly spikes above 80 percent, you need a larger SKU or workload optimization. The Fabric capacity metrics app (newer than the Power BI-specific one) provides per-workload breakdowns so you can see whether Power BI or Data Factory is the capacity hog.
The third lever is report lifecycle management. Power BI reports, like code, have a lifecycle. A report built for a one-off analysis that lives on for three years consumes development time, storage, refresh cycles and capacity with no business value. The FinOps practice for Power BI includes a regular report audit: who owns this report, when was it last viewed, and does the business still need it?
The Power BI REST API provides report usage metrics: view count, unique viewers, last view date. Reports with zero views in 90 days are candidates for archival or deletion. Reports with zero views in 30 days and an owner who has left the organization are candidates for immediate action. The audit is manual today, but an AI agent can query the Power BI API, generate the list of unused reports, and post it to the workspace owners for review.
Fabric turns Power BI into one workload among many
Fabric turns Power BI from a standalone BI tool into one workload among many on a shared capacity. This has two FinOps implications.
First, Fabric costs are shared across teams that used to have separate budgets. The data engineering team's Spark jobs and the BI team's report refreshes compete for the same CUs. Without workload-level chargeback, each team sees the other team's consumption as "free" and overconsumes, a classic tragedy of the commons. Fabric's capacity metrics app provides per-workload breakdowns, but chargeback requires manual reporting today.
Second, Fabric enables AI features (Copilot for Power BI, Copilot for Data Factory) that consume CUs at a higher rate than standard operations. A Copilot-generated DAX query consumes more CUs than a human-written query. The FinOps question is not "should we use Copilot?" but "how many CUs is Copilot consuming, and is the productivity gain worth the capacity cost?" Fabric's Copilot usage is metered and reported, but the data is new and most organizations have not built reporting around it yet.
An agent pattern for Power BI and Fabric
Microsoft has not released a dedicated Power BI or Fabric FinOps agent, but the pattern from AWS applies. The Power BI REST API exposes usage data for reports, datasets, dashboards and users. The Microsoft 365 admin center API exposes license assignments. The Fabric capacity metrics API exposes CU consumption by workload. An LLM agent with access to all three can generate a comprehensive FinOps report.
The highest-ROI agent use cases for Power BI are unused report detection, license audit automation and capacity utilization reporting. An agent that runs weekly, queries the Power BI activity log for reports with zero views in the last 30 days, cross-references against the report owner (who may have left), and posts a cleanup list to the BI team's Teams channel would save hours of manual audit work. An agent that monitors CU utilization and alerts when the maximum utilization exceeds 80 percent for more than 15 minutes would catch capacity issues before users complain about slow reports.
The most advanced use case is workload-aware capacity planning. An agent that models the CU consumption of each Fabric workload (Power BI, Data Factory, Synapse, Data Science) and projects capacity needs based on growth trends would help organizations right-size their Fabric commitment before renewal. This is a modeling task that humans can do in Excel but rarely update, and an agent can do weekly with live data.
Start with a license audit
Start with a license audit. Export your assigned licenses from the Microsoft 365 admin center. Cross-reference against user sign-in activity in Azure AD. For every user who has not signed in to Power BI in 90 days, flag the license for removal. For every user on PPU who has zero AI feature usage and zero models over 1 GB, downgrade to Pro. The audit takes an afternoon and typically saves 10 to 15 percent on license costs.
Then look at your capacity utilization. If you are on Premium or Fabric, install the capacity metrics app and review the last 30 days of utilization. If average utilization is below 40 percent, you can likely step down one SKU size at renewal. If maximum utilization regularly hits 100 percent, invest in report optimization (reduce refresh frequency, use incremental refresh, optimize DAX queries) before buying more capacity.
Finally, set up a quarterly report lifecycle audit. Use the Power BI REST API to identify reports with zero views in 90 days. Archive them. The storage savings are small. The capacity savings (from eliminating unnecessary refreshes) and the organizational savings (from reducing the surface area that the BI team supports) are significant.
For the broader FinOps lifecycle and where agents fit across platforms, see the overview. The AWS guide covers the AWS FinOps Agent pattern that applies to Power BI, and the Snowflake guide covers the equivalent for data warehouse credits.