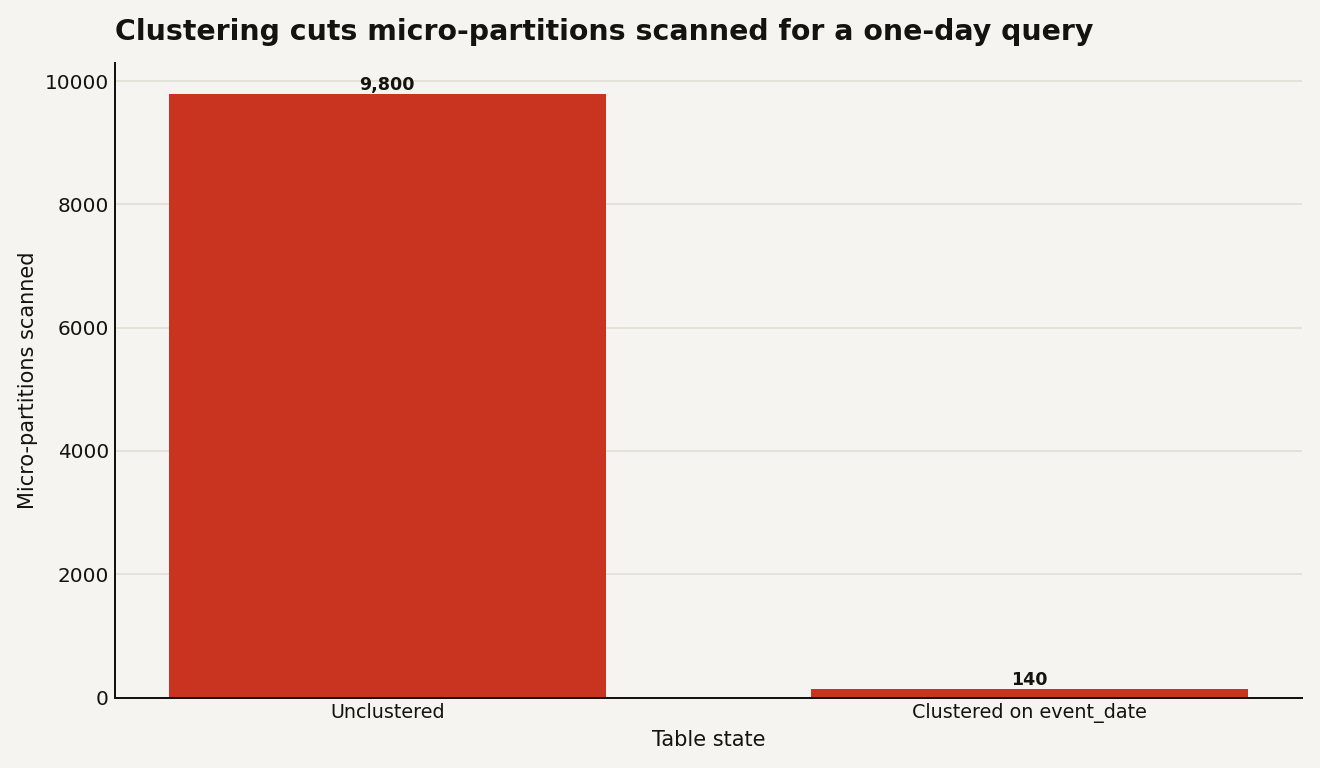
When a Snowflake query is slow, the instinct is to size up the warehouse. Sometimes that is right. Often the real problem is that the query is reading the whole table to answer a question about a sliver of it, and no amount of extra compute fixes a full scan, it just pays for it faster. The fix is pruning: getting Snowflake to skip the storage that cannot contain your answer. A clustering key is the main lever you have over how well that pruning works, and on the right table it is the difference between scanning 9,800 micro-partitions and scanning 140.
This guide is for the data engineer who owns a large, slow table and a query profile that says "partitions scanned" is close to "partitions total". The goal is to know when a clustering key earns its credits, and when it just quietly bills you for nothing.
How does Snowflake decide what to skip?
Every Snowflake table is silently split into micro-partitions, contiguous chunks holding 50 to 500 MB of uncompressed data each, stored column by column. For every micro-partition, Snowflake keeps metadata: the min and max value of each column, the distinct count, and more. That metadata is the whole game. When you filter WHERE event_date = '2026-06-01', Snowflake checks each micro-partition's stored range for event_date and skips any whose range cannot contain that date. Per Snowflake's own docs, a query touching 10% of a value range should ideally scan only 10% of the micro-partitions.
Pruning only works when the values you filter on are physically grouped together. Data lands in micro-partitions in roughly the order you load it. If you load by day, rows for one day already sit together and a date filter prunes beautifully for free. If you load in random order, every micro-partition holds a smear of every date, no range can be ruled out, and the query reads everything even though it returns almost nothing.
A clustering key tells Snowflake to keep the table physically sorted on the columns you actually filter by, so that smear never forms. You can check how good the current grouping is without changing anything:
-- How well is this table clustered on the column you filter by?
-- Lower average_depth = better pruning. A high depth on a big table
-- that you filter by event_date is the signal a clustering key may help.
SELECT SYSTEM$CLUSTERING_INFORMATION('events', '(event_date)');
The number that matters in the result is clustering depth: the average number of overlapping micro-partitions for that column. Depth near 1 means almost no overlap and excellent pruning. A large depth means heavy overlap and wasted scans.
Clustering is not the only pruning lever, and reaching for it reflexively is a mistake. If your slow queries are highly selective point lookups, WHERE customer_id = 12345 against a huge table, the Search Optimization Service often fits better: it builds a separate search-access index that prunes for equality and substring filters without physically reordering the table. It bills its own credits too, so the evaluation discipline is identical, but the two solve different shapes of problem. Clustering wins on range and date filters that scan a contiguous slice; search optimization wins on needle-in-haystack lookups across the whole table.
What does a clustering key cost, and where does it break?
A clustering key is not free, and this is where teams get burned. Once you set one with ALTER TABLE events CLUSTER BY (event_date), Snowflake's automatic clustering service reorganizes micro-partitions in the background to keep the table sorted as new data arrives. That background work is serverless compute, and it bills credits that show up in AUTOMATIC_CLUSTERING_HISTORY, separate from your warehouses. The more the table churns, the more reclustering it triggers, and the more you pay.
That cost profile decides where clustering wins and where it loses money:
| Table profile | Clustering key? | Why |
|---|---|---|
| Large, filtered by one date/ID column, append-mostly | Yes | Pruning savings dwarf the steady reclustering cost |
| Small (under a few GB) | No | Snowflake already prunes it well; you would pay to reorder nothing |
| High-churn, rows updated all over the key | Rarely | Constant reclustering can cost more than the queries save |
| Filtered by many different columns each query | No | One key cannot serve every filter; pick the dominant one or none |
Two rules keep you out of trouble. First, cluster on low-cardinality-to-medium columns you filter on, like a date or a region, not a unique ID with billions of values, because an ultra-high-cardinality key forces near-constant reordering. Second, do not cluster a table that fits in a handful of micro-partitions; Snowflake prunes small tables fine on its own and the service would bill you to sort data that was never the bottleneck.
How do I roll it out without guessing?
Prove the need before you turn anything on, then measure the bill after.
- Confirm the table is actually scan-bound. Open the query profile for the slow query and compare "partitions scanned" to "partitions total". If you are scanning most of the table to return a small result, pruning is failing and clustering is a real candidate. If the scan is already small, your problem is elsewhere (a join, spilling, or a missing filter) and a clustering key will not help.
- Baseline, then enable on one table. Record the query runtime and the
SYSTEM$CLUSTERING_INFORMATIONdepth. Set the key withALTER TABLE ... CLUSTER BY, let automatic clustering settle over a day or two, then re-measure both the query and the credits inAUTOMATIC_CLUSTERING_HISTORY. - Compare savings against the reclustering bill. This is the step people skip. If the query got 20x faster and reclustering costs a few credits a day, keep it. If reclustering is burning more than the warehouse time you saved, suspend it with
ALTER TABLE ... SUSPEND RECLUSTERor drop the key.
The rollback is clean: ALTER TABLE events DROP CLUSTERING KEY stops the service and leaves the data in place. Nothing breaks, you just stop paying for ordering. Before you reach for a clustering key at all, make sure the warehouse running the query is the right size, because the two levers interact. The warehouse sizing guide covers that side, and the rest of the Snowflake guides go deeper on the query profile.
The number to watch
Track partitions scanned divided by partitions total for your heaviest recurring query. That ratio, not raw runtime, tells you whether pruning is working. When it is high on a big table you filter the same way every day, a clustering key is worth a test. When it is already low, leave the table alone and spend the credits somewhere they move the needle.