The annoying pipelines rarely fail first. They usually get weird first: a 12 minute load turns into 19 minutes, an iterator step crawls through one customer after another, or a transformation finishes suspiciously fast because it processed almost nothing. That gray zone is where Matillion anomaly alerts now matter.
Matillion has added duration anomaly notifications to Maia, its AI layer for the Matillion Data Productivity Cloud. The important number is 10 successful runs: Matillion says a pipeline needs at least 10 successful runs before anomaly alerts can be generated, and Maia can use up to 300 successful runs to build the duration baseline in its pipeline notifications documentation. This is a practical observability feature, not magic failure prediction. It gives you an operational warning when runtime drifts from the pipeline's own history.
That distinction matters if you influence the bill. Duration is one of the cleanest early signals that something changed: source volume, warehouse queueing, connector behavior, branch changes, environment configuration, or a runner problem. An alert that fires while a slow run is still executing can save compute before the end state shows up as a red failure, a missed SLA, or a larger credit line item.
What exactly changed in Maia pipeline observability?
Matillion's 2026 changelog says you can now subscribe to anomaly alert notifications through Email, Slack, or Webhook when a pipeline run's duration deviates significantly from historical baselines, with the feature listed under Pipelines, Observability, and a minimum Maia version of all supported versions in the June 17, 2026 changelog entry. The public roadmap post on June 19 bundled this with iterator visibility and GitLab API support, but the duration alert is the operationally heavier change because it turns pipeline drift into a push signal.
The earlier Maia observability flow already had anomaly indicators in Pipeline Runs: red arrows beside duration metrics, a hover tooltip, and an anomalies section on the run detail. Matillion's troubleshooting guide gives the example of a run being 7.8 percent longer than expected in its Maia AI Agents troubleshooting documentation. The new subscription path is the difference between noticing a red arrow when you happen to check the dashboard and getting paged into the right Slack channel before the run quietly burns through the morning.
The feature only applies to scheduled or API-driven pipeline runs. Matillion says notifications are sent for scheduled or API-driven runs, while pipelines run manually through Designer do not generate notifications in the Pipeline notifications guide. That is the right boundary. Manual runs are often experiments. Scheduled and API-triggered runs are production behavior.
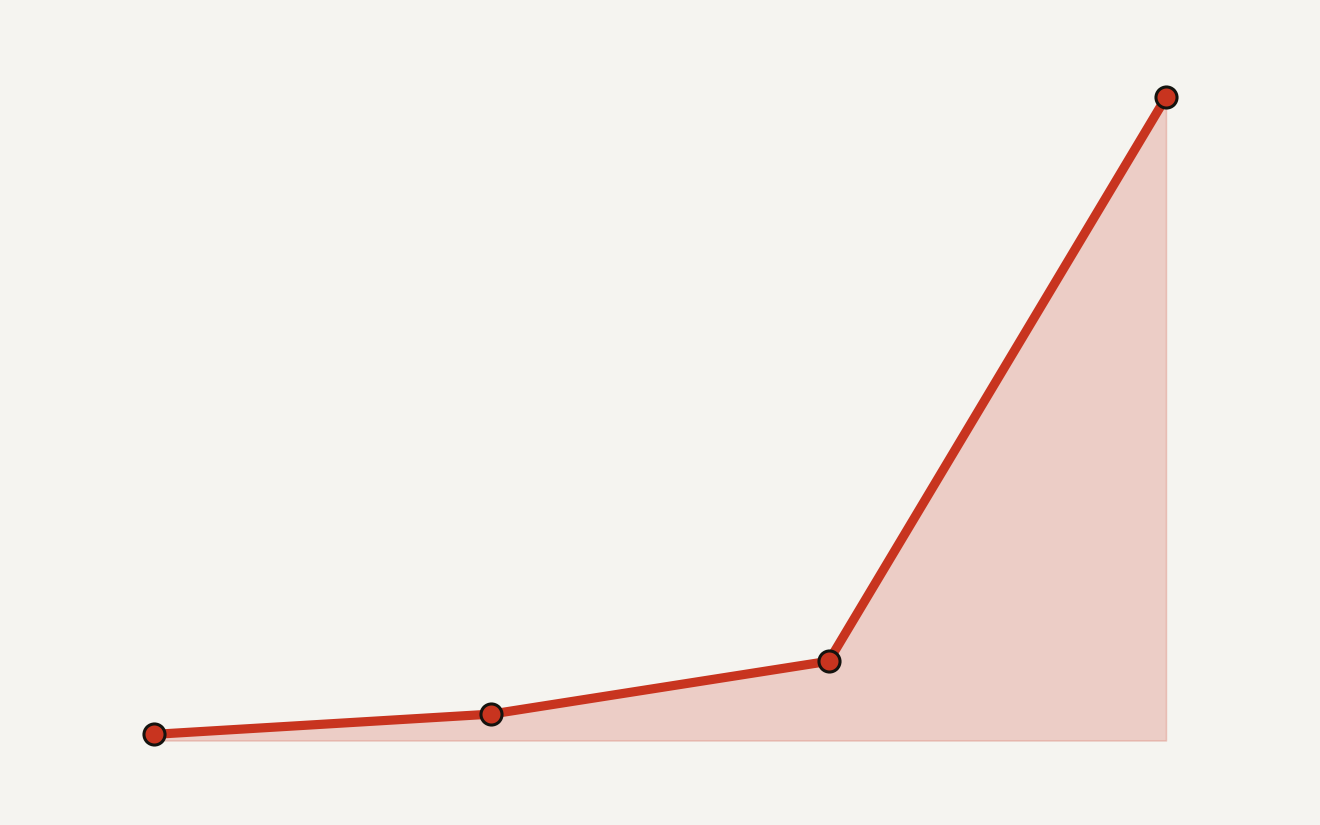
Here is the baseline math Matillion documents, with the two numbers you should remember before you file a ticket about missing alerts.
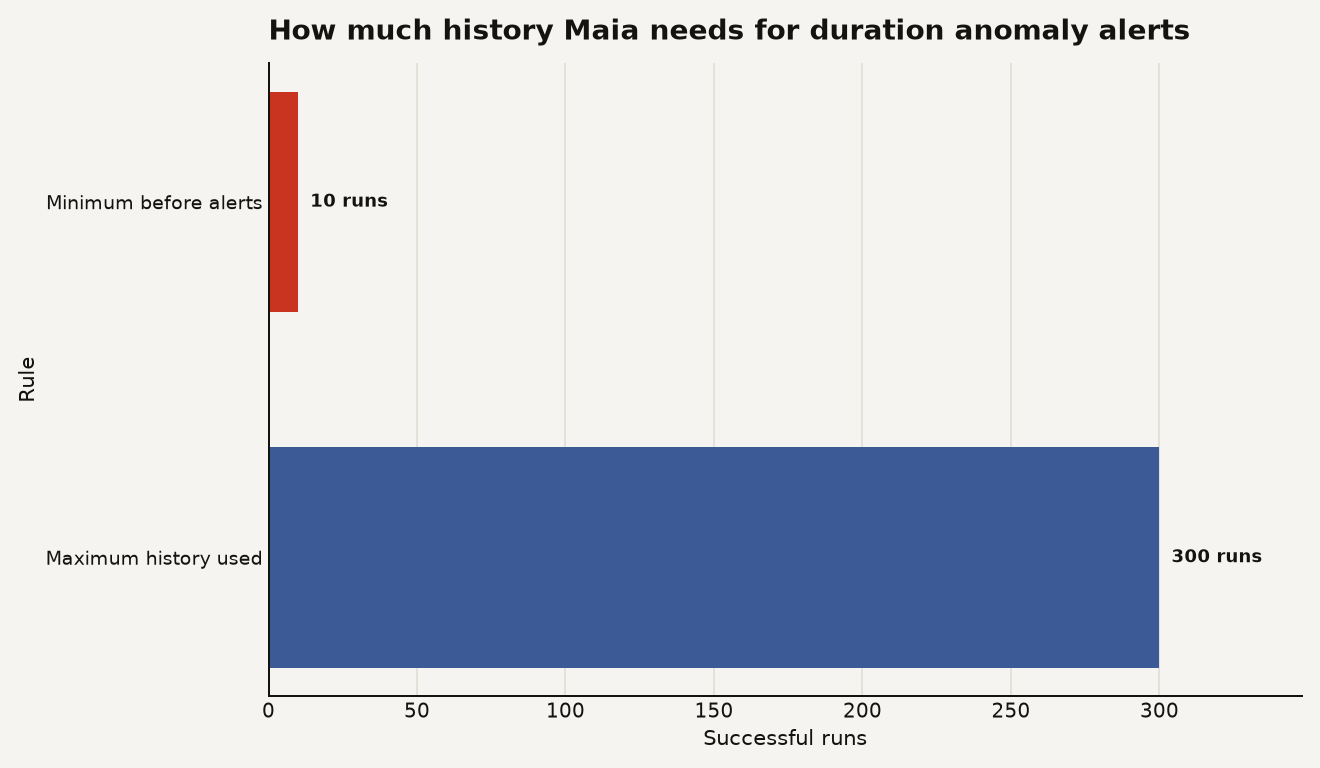
The chart above is blunt on purpose: 10 successful runs are the floor, and 300 successful runs are the maximum recent history Maia uses for the baseline. If you deploy a new production pipeline and schedule it hourly, anomaly alerts cannot reasonably help you on the first day. If you schedule it once per day, give it at least 10 successful days before you expect the alerting model to settle.
How does Maia decide that a runtime is abnormal?
Maia compares each pipeline against its own recent duration history. Matillion says the expected range is built from successful runs of that pipeline, centered on the median duration, with spread measured toward the 99th percentile on the slow side and the 1st percentile on the fast side in the anomaly alert calculation notes. That is a useful design choice because a pipeline that usually varies between 8 and 40 minutes should not alert the same way as a pipeline that reliably finishes between 58 and 62 seconds.
The slow side is the one most teams will care about first. Matillion says a slow anomaly can be detected while a pipeline is still running, while a fast anomaly is detected only at completion in the duration anomalies section. That means Maia can warn you before the run ends when the elapsed runtime crosses the expected upper bound. For cost control, that timing is the feature.
Fast anomalies deserve more respect than they usually get. A pipeline finishing in one tenth of its normal time can mean a source delivered zero rows, a branch skipped the real work, an environment variable pointed to a smaller schema, or an upstream extract silently changed. Matillion says the lower bound is the median minus twice the downward spread and never drops below zero, which means many pipelines will never trigger a fast anomaly unless their normal runtime is long and consistent in the same expected range explanation. In plain builder terms: do not count on fast alerts for every pipeline. Count on them for stable, long-running jobs where “too quick” is actually suspicious.
The model is intentionally per-pipeline. That avoids the lazy alerting pattern where every job inherits a single global SLA and the useful signals drown in noise. A five minute Salesforce Load and a two hour warehouse transformation should have different ideas of normal.
How do you configure the alert without wiring every pipeline by hand?
Configuration lives in Notifications, not on every component canvas. Matillion says registered Maia users can configure pipeline notifications at the project and environment level for completion alerts and anomaly alerts in the notifications overview. That is the right place for it, because alert routing is an operational concern. You want production to hit a high-priority channel and development to stay in a sandbox channel.
For email anomaly alerts, the setup is short: open the Profile and Account menu, choose Notifications, add an anomaly alert, select Enable anomaly alerts, choose Email, and add the notification. Matillion states that email alerts go to the email address associated with your Maia account and need no extra setup in its email setup instructions.
Slack needs a webhook URL and a name. Matillion lists Slack Webhook URL and Slack Webhook Name as required fields when configuring Slack anomaly alerts in the Slack anomaly setup section. That is simple, but it also means channel design matters. Do not point every environment at the same room unless you enjoy training people to ignore red lights.
Webhook delivery is the most useful option for teams that already route incidents through ServiceNow, PagerDuty, Teams bridges, or internal automation. Matillion says webhook anomaly alerts require a Webhook URL, Webhook Name, and Payload Template in the webhook setup section. The catch is security: Matillion documents these webhooks as outbound only and says their payloads are not signed with HMAC in the same webhook behavior note. Put an API gateway, shared secret, allow list, or other control in front of the receiving endpoint. A naked endpoint that takes operational actions from unsigned JSON is how incident automation becomes incident creation.
A compact webhook payload for a slow anomaly could look like this:
{
  "text": "${pipelineName} duration anomaly: ${elapsedDurationSeconds}s elapsed, upper bound ${expectedUpperBoundSeconds}s",
  "executionId": "${pipelineExecutionId}",
  "environment": "${environmentDisplayName}",
  "startedAt": "${startedAt}"
}
The variable names above come from Matillion's anomaly webhook template support, which includes ${elapsedDurationSeconds}, ${expectedUpperBoundSeconds}, ${expectedLowerBoundSeconds}, ${pipelineExecutionId}, and ${triggerType} in the available variables list. Keep the payload small. The first alert should tell the on-call engineer what is drifting and where to click, not dump a novella into Slack.
| Alert path | Trigger behavior | Best use | Hard limit to remember |
|---|---|---|---|
| Email anomaly alert | Sends to the Maia account email when an anomaly is detected | Small teams and low-noise production projects | Requires at least 10 successful pipeline runs |
| Slack anomaly alert | Sends to a Slack channel through an incoming webhook URL | Team triage by project or environment | Requires a Slack Webhook URL and Slack Webhook Name |
| Webhook anomaly alert | Sends an HTTP POST with your custom JSON template | Incident tools, internal routing, and FinOps automation | Outbound only and not HMAC signed |
What does this cost, and where can it save money?
Matillion does not document a separate credit price for anomaly alerts in the notification guide. The cost angle is indirect and more useful: runtime anomalies tell you when a pipeline is consuming time outside its normal envelope, and time is where warehouse, runner, and orchestration costs usually hide.
The cleanest workflow is to treat a slow anomaly as a cost investigation starter. Matillion's REST API consumption data is not real time, since the June 10 changelog says GET /v1/consumption data refreshes every three hours to reflect recent credit usage in the API update notes. That lag means anomaly alerts are the faster operational signal, while consumption reporting is the later accounting signal.
Use both. If Maia alerts that nightly_customer_mart crossed its expected upper bound at 02:14, you inspect Pipeline Runs immediately. Later, you check consumption by pipeline, project, or user once the usage data refreshes. Matillion's MCP server documentation explicitly includes cost optimization use cases such as analyzing credit consumption, seeing breakdowns by pipeline and execution frequency, and identifying expensive pipelines in the MCP server use case table. The alert tells you where to look. Consumption data tells you what it cost.
This is also where alert tuning becomes business work, not only engineering hygiene. A pipeline that runs 30 percent long once after a large customer import may be acceptable. A pipeline that drifts 8 percent longer every weekday for two weeks is a margin leak with a nicer UI. If you already use Maia context and governance patterns, connect this operational signal to your broader standards. Our guide to Matillion Context Engine cost controls is a useful companion because the same discipline applies: give Maia enough context to help, but keep humans accountable for cost policy.
When should you trust the alert, and when should you be skeptical?
Trust the alert when the pipeline has stable history, runs on a schedule, and does meaningful work every time. A nightly dimension rebuild, a predictable Salesforce incremental load, or a transformation pipeline behind an executive dashboard are good candidates. If the pipeline has at least 10 successful runs and normally lands in a tight runtime band, an alert is a real signal.
Be skeptical when the workload is naturally lumpy. Month-end finance jobs, backfills, campaign data imports, and pipelines with parameter-driven row counts will produce wider expected ranges because their past durations are wider. Matillion says naturally variable pipelines get a wider range so ordinary fluctuation does not trigger false alerts in the expected range explanation. That behavior is good, but it also means a genuinely bad run might need to be very bad before it crosses the threshold.
Also watch branch and environment changes. Matillion's pipeline run history shows fields such as status, environment, artifact version, trigger, start time, end time, and duration in the pipeline run history documentation. If an anomaly follows a new artifact version, start with the diff. If it follows an environment change, start with variables, warehouse sizing, secrets, and connection overrides. If it follows neither, start with source volume and platform health.
One more practical guardrail: do not auto-kill long-running jobs from the first webhook you receive. Use the webhook to open an incident, enrich a ticket, or notify the owning channel. Termination should require a second rule, such as the run exceeding a business SLA, a known bad artifact version, or a warehouse spend threshold.
What would I do before turning this on in production?
Start with your top five scheduled or API-driven pipelines by business impact, not your loudest pipelines. Pick jobs with clear owners, stable schedules, and visible cost or SLA consequences. Then configure anomaly alerts at the production environment level and route them to a channel where someone is actually expected to respond.
For each pipeline, capture four pieces of runbook context:
- The normal schedule and expected business deadline.
- The primary source systems and largest transformation tables.
- The first Matillion page to inspect, usually Pipeline Runs or the run detail view.
- The cost check to run after the three hour consumption refresh window.
Do not overbuild on day one. The first useful version is one notification, one channel, and one runbook link. After a week, add webhook routing for the pipelines that produce actionable signals. If alerts are noisy, check whether the pipeline is parameterized or lumpy by design before blaming Maia.
The bigger point is cultural. Runtime drift is often treated as a nuisance until it becomes a failure. Maia's duration anomaly alerts make drift visible early enough to do something cheaper than a postmortem. That is the feature's value: it moves the conversation from “why did the dashboard miss?” to “why is this job behaving differently right now?”